Consumer Behavior
Americans' Daily Social Media Use By Device [CHART]
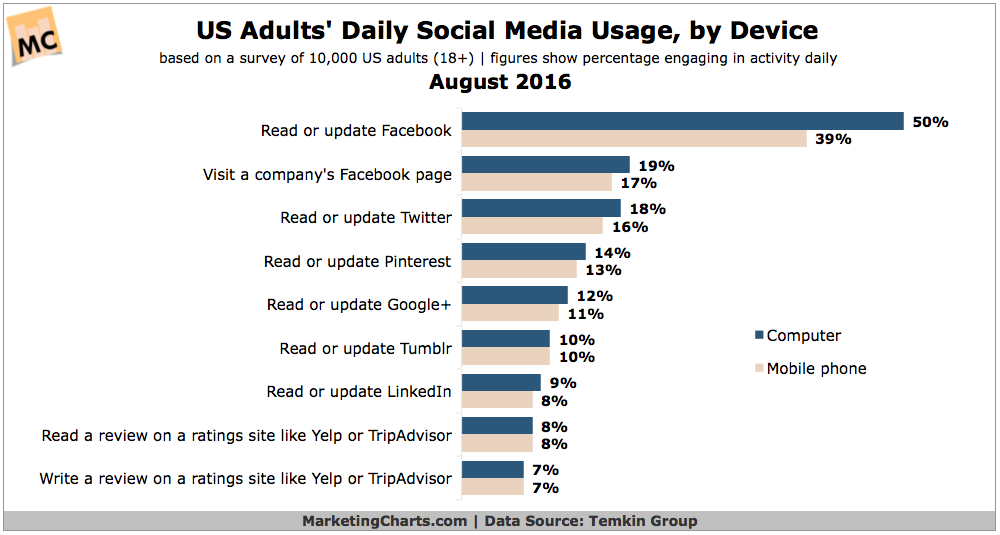
Some 19% of American adults visit a company’s Facebook page each day from a computer, and a similar proportion (17%) do so every day from their mobile phone.
Read MoreAmericans' Alcohol Consumption & Preferences [CHART]
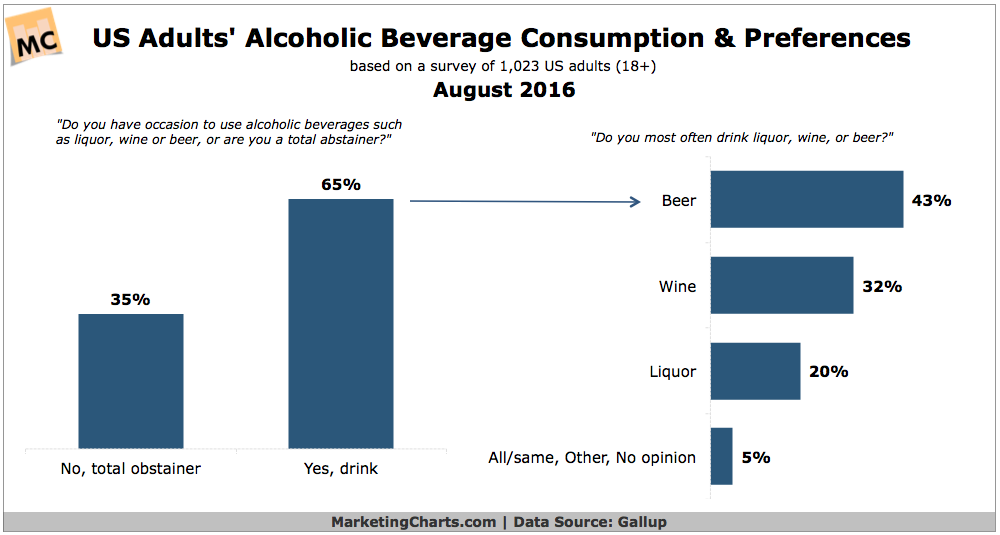
Almost two-thirds (65%) of American adults drink alcoholic beverages on occasion, well within the 55-71% range observed over the past 70-odd years.
Read MoreAmericans' Historic Touchstones By Political Party [TABLE]
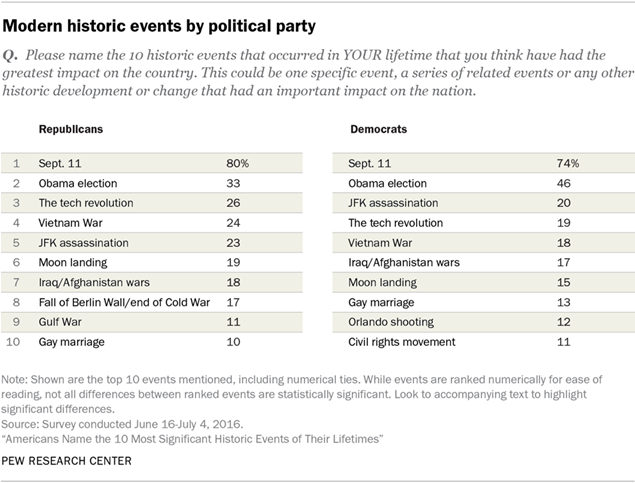
The events in American history named by Republicans and Democrats overlap substantially, and differences between the two parties are primarily a matter of degree.
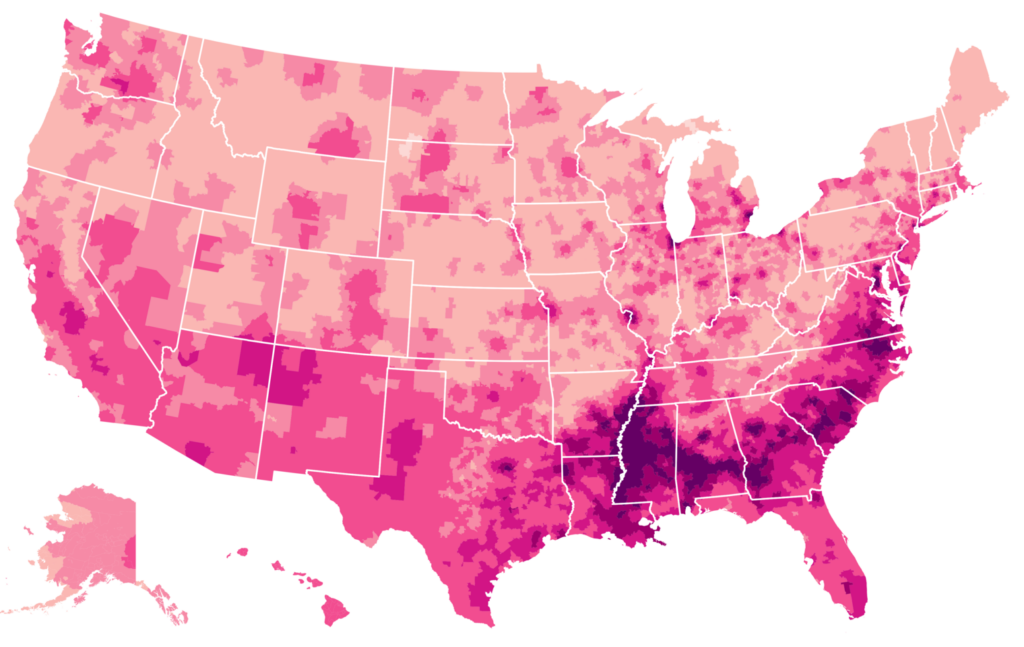
Read MoreAmericans' Historic Touchstones By Race [TABLE]
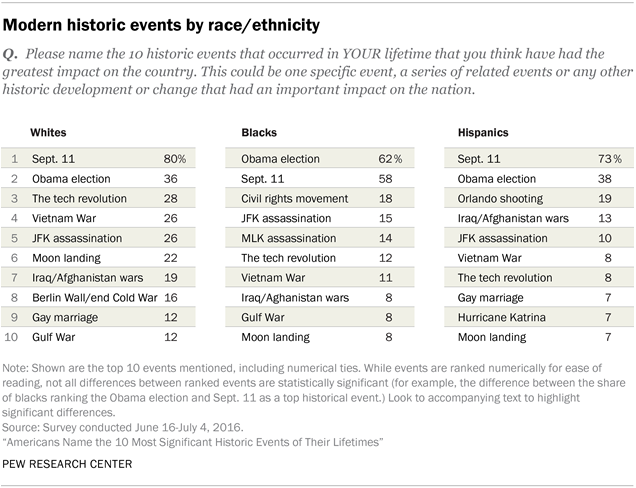
Blacks are the only demographic group in which any other historic event challenges the prominence of Sept. 11 in importance.
Read MoreAmerican Cultural Divide: 3 TV Shows' Popularity By Geography [MAPS]
The New York Times has analyzed Facebook data on the demographics of Americans who like 50 different television shows by way of illustrating America’s cultural divide.
Read MoreAmericans' Historic Touchstones By Generation [TABLES]
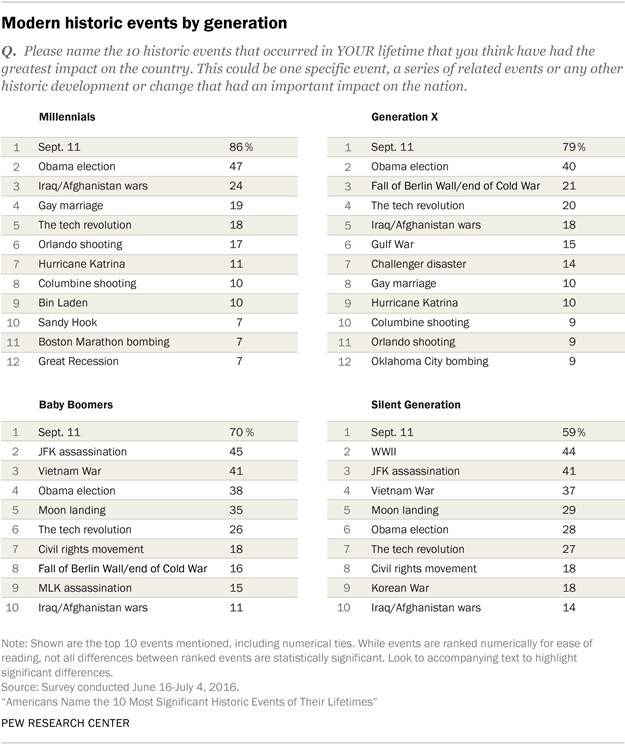
Shared experiences define what it means to be an American. The Sept. 11, 2001, terrorist attacks were such a unifying event for modern Americans.
Read MorePre-Suasion: Preparing For Persuasion [INFOGRAPHIC]
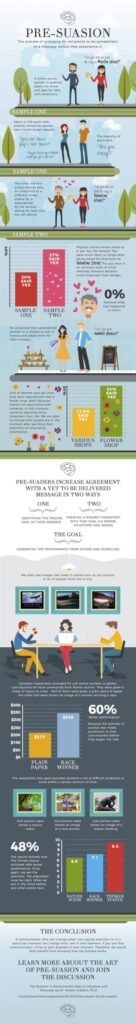
This infographic, based on the research included in Author Robert Cialdini’s book Pre-Suasion, illustrates the importance of setting the stage for people to be in the right frame of mind in order to be persuaded by a marketing message.
Read MoreAudience Retention Rates by Length of Podcast [CHART]
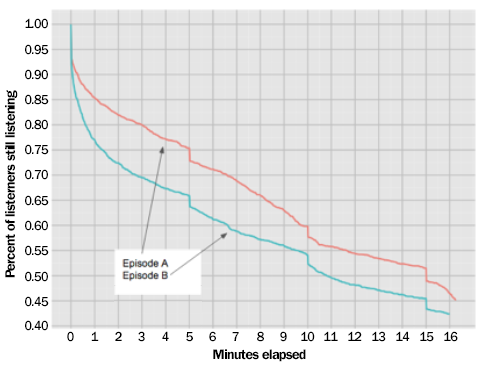
Listeners make their decisions to commit to a podcast in those crucial opening moments. A mediocre episode with a good intro will almost always perform better than a great episode with a poor intro.
Read MoreLocal Radio Newscast Completion Rates by Duration [CHART]
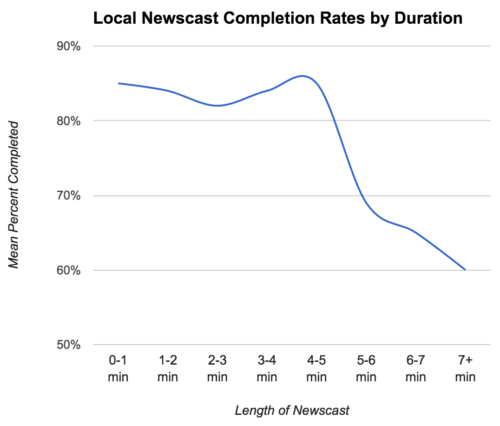
There is a sharp drop off in newscast listening when a cast exceeds five minutes.
Read MoreWho The Public Blames For Spread Of Fake News [CHART]
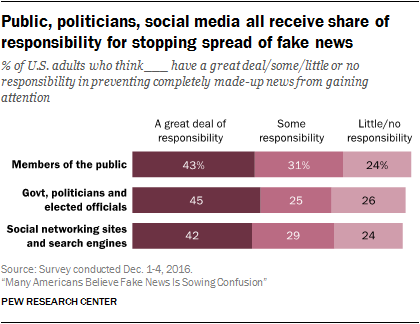
Fully 45% say government, politicians and elected officials have a great deal of responsibility for the spread of fake news.
Read More