Consumer Behavior
Top Content Consumed Weekly On Tablets [CHART]
According to a March 2012 Online Publishers Association study, accessing content & information was the top reason US tablet users reached for their devices.
Read MorePreferred Feedback Channel By Generation [CHART]
via emarketer.com When Maritz broke its data down among age groups, it found that the type of contact consumers favored to reach companies was closely linked to users’ age. Younger customers were more likely to embrace public feedback on a social network, while older consumers preferred older methods of direct contact with a company. Unsurprisingly,…
Read MoreFrequency Of Tablet Use At Work [CHART]
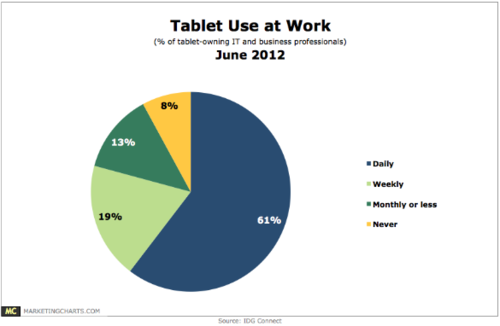
via marketingcharts.com Tablets are increasingly becoming a staple at work for the corporate professional, according to research released in June 2012 by IDG Connect. 71% of the more than 3,000 IT and business professionals responding to the survey said they already own a tablet, with roughly 3 in 5 using it daily for work. Breaking…
Read MoreResponse Rates For Select Media [CHART]

via marketingcharts.com Direct mail campaigns benefit from higher response rates than various other channels, finds the Direct Marketing Association (DMA) in a June 2012 study. Comparing rates over time, the report indicates that the response rate for direct mail to an existing customer averages 3.4%, compared to 0.12% for email. Interestingly, (letter-sized) direct mail’s relative…
Read MorePrimary Source Of Political Information, By Gender [CHART]
via emarketer.com This change makes sense in the context of the results of an April 2012 online survey of US online adults conducted by Burst Media. The poll found that 27.7% of likely voters got their information about candidates and causes primarily on the internet, a 10% jump over 2008. In fact, the internet was…
Read MoreLocation-Based Services Use Frequency [CHART]

via emarketer.com About one-third of respondents said they had increased their use of such services over the past year, while another third said their use had stayed about the same. Only 10% of those polled had reduced their use of geolocation apps or other products. Read the rest at eMarkerter.
Read MoreSocial Media Users' Responses To Consumer Experiences [CHART]
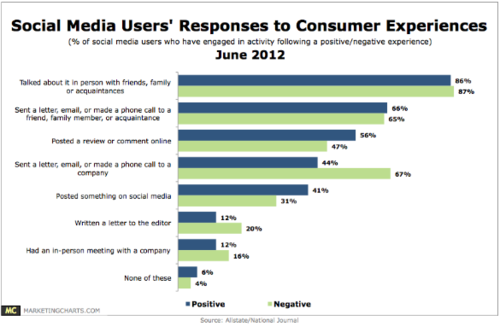
via marketingcharts.com Consumers who have used social media for customer service are more engaged and vocal in speaking about their experiences than the general population, says American Express in May 2012 survey results, and the Allstate survey appears to back this finding up. Further data from the survey reveals that social media users are more…
Read MoreSocial Media Users' Consumer Activities [CHART]
via marketingcharts.com Active social media users are more likely than the average person to have engaged in a variety of consumer activities, whether online or in person, finds a survey [pdf] released in June 2012 by Allstate, in association with National Journal. They are almost 10% more likely than the average respondent to have consulted…
Read MoreAttitudes By eShoppers Toward Retailers With Convenient Returns [CHART]
via emarketer.com A clear, lenient return policy can go a long way in building good will with customers who don’t want to feel penalized for returning items. Almost half of shoppers would shop more often with a retailer with a clear return policy, and the same number would recommend the retailer to a friend as…
Read MoreTypes Of Online Behavior Executives Value [CHART]
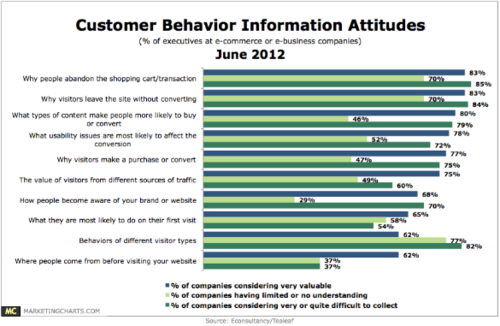
via marketingcharts.com econsultancy-customer-behavior-attitudes-june2012.pngMany executives working at companies with e-commerce or e-business components have only a limited understanding of why people abandon the shopping cart or transaction, according to [download page] a survey released in June 2012 by Econsultancy in association with Tealeaf. As a result, all the respondents say that understanding why people do this…
Read More