Consumer Behavior
Top 10 TV Programs By Cost Of 30-Second Spot, 2011-2013 Season [CHART]
NBC’s “Sunday Night Football” commands the highest average price for a 30-second spot.
Read MoreAmerican Tablet Users & Penetration, 2010-2015 [TABLE]

By the end of 2012, eMarketer estimates the number of US tablet users will reach nearly 70 million, up from 34 million in 2011.
Read MoreMobile Device Payment Transaction Value, 2011-2016 [CHART]

By 2016, mobile device payments will have exploded in the US, and total transaction value will hit $62.24 billion.
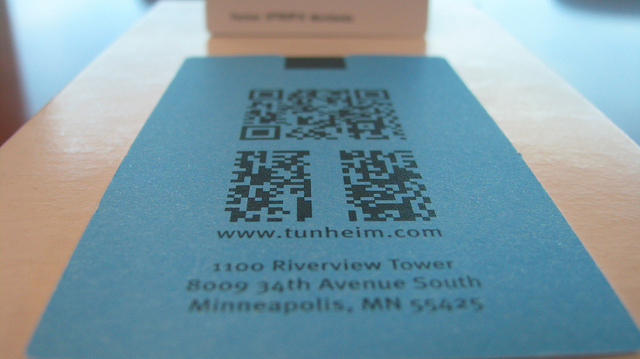
Read MoreHistory Of The Barcode [INFOGRAPHIC]
This infographic from Wasp looks at the history of the barcode.
Read MoreCelebrating Thanksgiving [INFOGRAPHIC]
Nationwide put together this infographic to illustrate how we celebrate Thanksgiving.
Read MoreVideo Recommenders By Political Affiliation [TABLE]
23% of internet-using registered voters have encouraged others to watch online videos related to the election or political issues this campaign season.
Read MoreOnline Video Recommendations By Political Affiliation [TABLE]
Pew Internet breaks down the politics of people who recommend online videos.
Read MoreTypes Of Political Videos Voters Watch Online [TABLE]
48% watch video news reports about the election or politics.
Read MoreSmall Business Social Media Spending [INFOGRAPHIC]
This infographic from VerticalResponse looks at what small businesses are spending on social media.
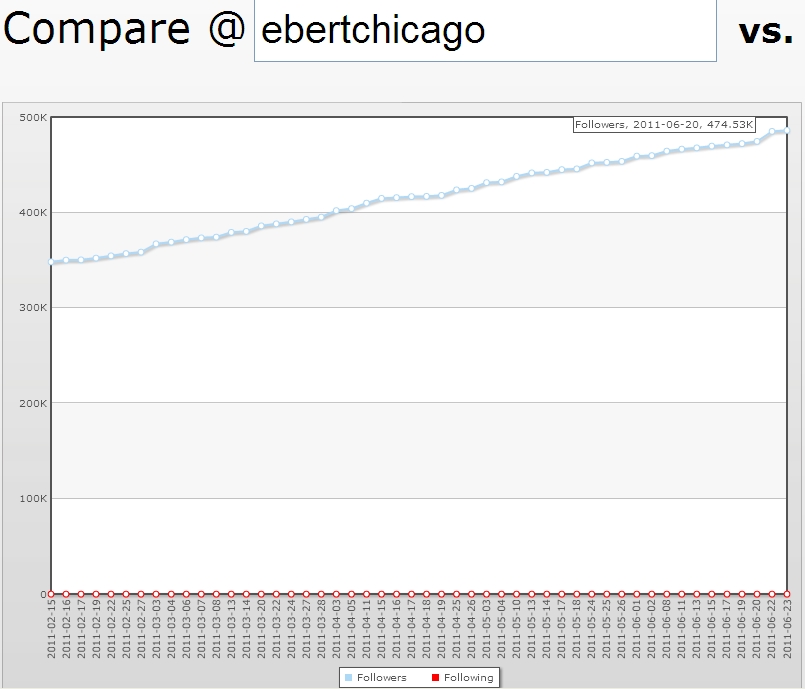
Read MoreBuilding YouTube Audiences [INFOGRAPHIC]

This infographic by FanBridge takes a look at how YouTube channel owners are building audiences.
Read More