Consumer Behavior
US Retail mCommerce Sales By Device, 2011-2016 [CHART]
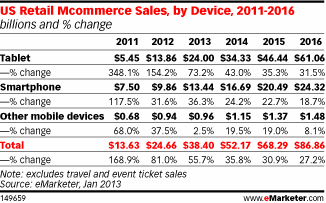
This year, US consumers will spend $24 billion shopping on their tablets, and that figure will nearly double by 2015.
Read MoreFrequency Of Mobile Social Network Visits, July 2011 & March 2012 [CHART]
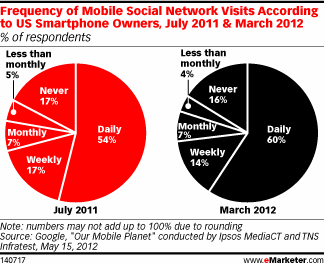
In the US, 60% of smartphone users surveyed by Google in March 2012 reported that they visited mobile social networks daily, up from 54% in July 2011.
Read MoreDevices On Which People Access Social Media, 2011 & 2012 [CHART]
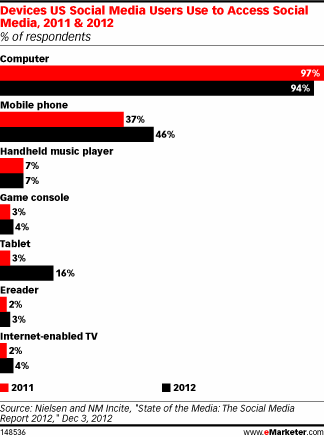
There is no question that social media has gone mobile, as more and more consumers access their accounts via smart phones and tablets.
Read MoreRetail mCommerce, 2011-2016 [CHART]
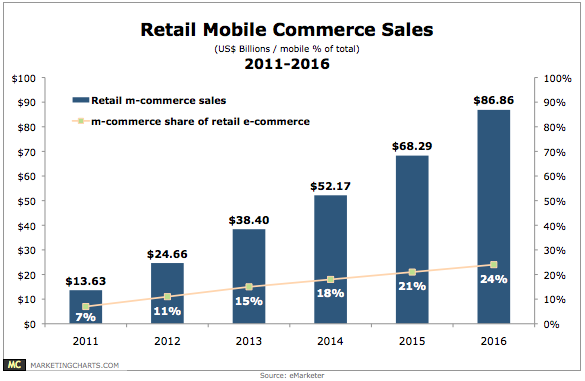
Mobile devices had a strong influence on the 2012 holiday season, and look set to continue that momentum through this year and beyond.
Read MoreCollege Student Access To Select Media By Channel, January 2013 [CHART]
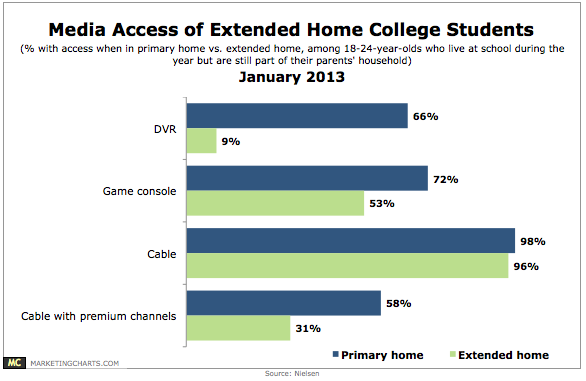
The 18-24 demographic is watching slightly less TV these days, and concurrently watching more internet and mobile video.
Read MoreAmericans' Attitudes Toward Quality Of Life Factors Compared To Other Nations, January 2013 [CHART]
Americans are sour on their health care system and neutral on their economic system, but they firmly believe that their individual freedoms outshine those afforded citizens in other modern, industrialized nations.
Read MoreDaily Time Spent Social Networking By Demographic, January 2013 [CHART]
Americans aged 18-64 who use social networks say they spend an average of 3.2 hours per day doing so.
Read MoreAmerican Search Advertising Click Behavior by Region & Age, January 2013 [CHART]
22% of online Americans say that they click on search engine ads.
Read MorePercentage Of Web Traffic From Mobile Devices, Q4 2011-Q4 2012 [CHART]
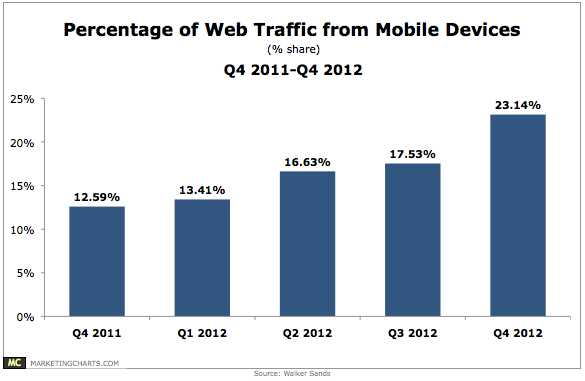
The percentage of website traffic coming from mobile devices jumped from 17.5% in Q3 2012 to 23.1% in Q4 2012.
Read MoreSponsorship Spending, 2009-2013 [CHART]
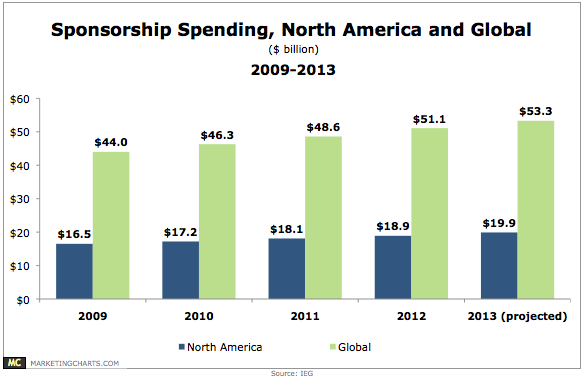
Total global corporate spending on sponsorships is slated to increase by 4.2% this year to $53.3 billion.
Read More