Consumer Behavior
YouTube Eyetracking Attention Order [HEATMAP]
This heatmap illustrates the order in which people focus their attention on YouTube pages.
Read MoreConsumers Who Would Consider Replacing Laptop With Tablet By Demographic, 2013 [CHART]
18- to 44-year-olds were significantly less likely than older people to expect to use the computer most often—in many cases citing smartphones or tablets instead.
Read MoreDevices People Use To Consume News & Entertainment By Demographic, 2013 [CHART]
In the 18- to 34-year-old demographic in particular, TV’s edge is slipping.
Read MoreOnline Shopping Cart Metrics, Q3 2011 – Q3 2012 [CHART]
The add-to-cart rate increased by 2 percentage points, while the cart conversion rate decreased by 2.7 points from 2011 to 2012.
Read MoreShopping Cart Abandonment Rates, Q4 2009 – Q3 2012 [CHART]
Over the past four years shopping cart abandonment rates have run in the 60% range, meaning six in 10 shoppers who place items in a cart do not check out.
Read MoreReasons For Online Shopping Cart Abandonment, February 2012 [CHART]
Smart retailers are recognizing that while some abandoned carts do indeed represent missed revenue opportunities, many others do not.
Read MoreSmall Biz Owners Perceptions & Use Of Social Media, February 2013 [CHART]
LinkedIn is not only the most commonly used social media tool by small businesses, but also the most positively perceived.
Read MoreAmericans Keeping Informed About Brands via Social By Demographics, February 2013 [CHART]
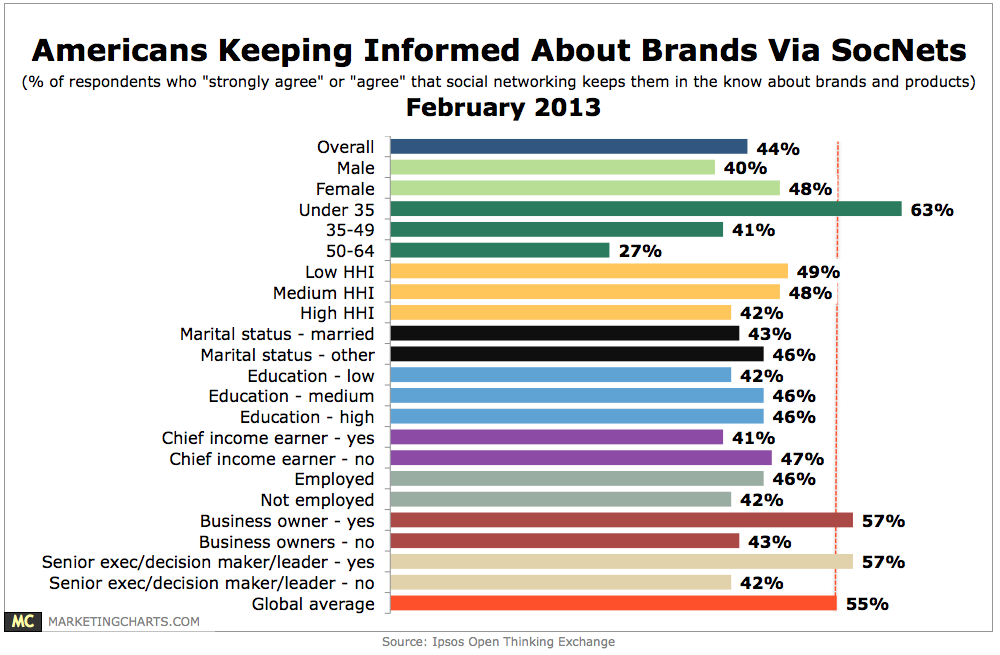
44% of Americans agree that social networking keeps them in the know about brands and products.
Read MoreConsumers Attitudes Toward Social Logins, February 2013 [CHART]
Awareness and use of social login was high among the online survey respondents, at 87% and 52%, respectively.
Read MoreMobile OS Market Share, Q3 2012 [CHART]

64% of mobile game impressions came from devices running the Android OS in Q3, while 30% came from iOS.
Read More