Consumer Behavior
Frequency Of Social Media Use Among Nonprofits By Channel, October 2012 [TABLE]
Ninety-six percent of nonprofits said they were on Facebook vs. 90% of small businesses.
Read MoreTime Spent On Social Media Among Nonprofits, October 2012 [CHART]
More than three out of five nonprofit organizations reported spending more time on social media than they did a year ago.
Read MorePreferences For Subscription vs. Ad-Supported Streaming Content By Device, November 2012 [CHART]

Most consumers still prefer free, ad-supported content though those with connected TVs are more likely to like the ad-free subscription model.
Read MoreHouse Of Cards Twitter Chatter [CHART]
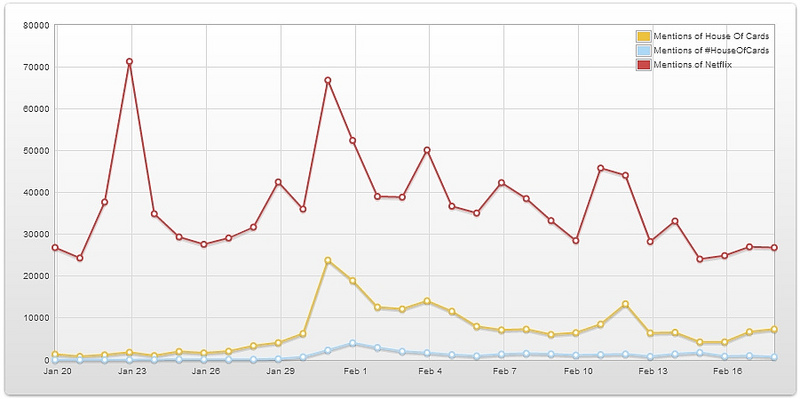
Not surprisingly, the use of a #HouseOfCards hashtag is very low, considering Netflix has never promoted its use.
Read More10% Of Netflix Subscribers Have Streamed House Of Cards

About 10 percent had watched House of Cards during the first few weeks it was available.
Read MoreThe Economic Impact Of Mapping [INFOGRAPHIC]
Google put together this infographic to illustrate some examples of the benefits of maps.
Read MoreThe State Of Infographics [INFOGRAPHIC]
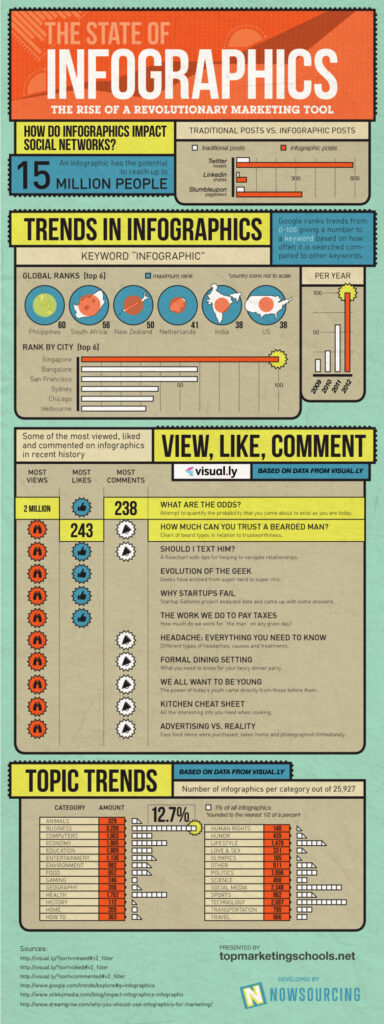
This infographic by Nowsourcing illustrates the effectiveness of infographics as a marketing tool.
Read MoreTrusted Sources Of General News & Information [CHART]
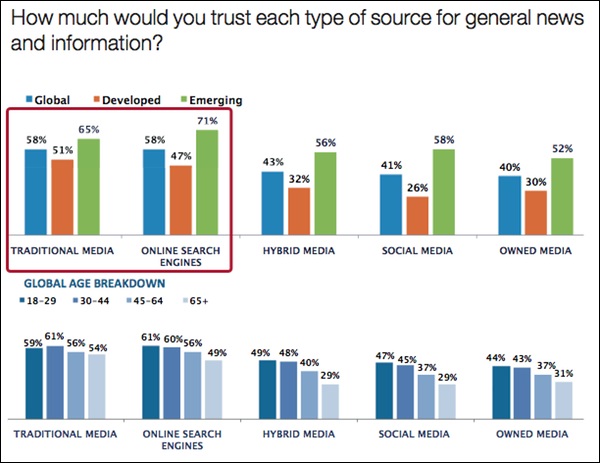
Trust in media is up five percent over last year, with search engines and traditional media topping the list: 58 percent overall said they trust those sources for news and information.
Read MoreVideo Ad Completion Rates, Q4 2011 – Q4 2012 [TABLE]
Ad completion rates were highest for long videos in Q4 2012 at 93%, compared with 81% for mid-form videos and 68% for short-form videos.
Read MoreVideo Ad View Rates, Q4 2011 – Q4 2012 [TABLE]
Total video views among internet users in the US were up 23% year over year in Q4 2012.
Read More