Consumer Behavior
Latinos Identities, February 2013 [CHART]
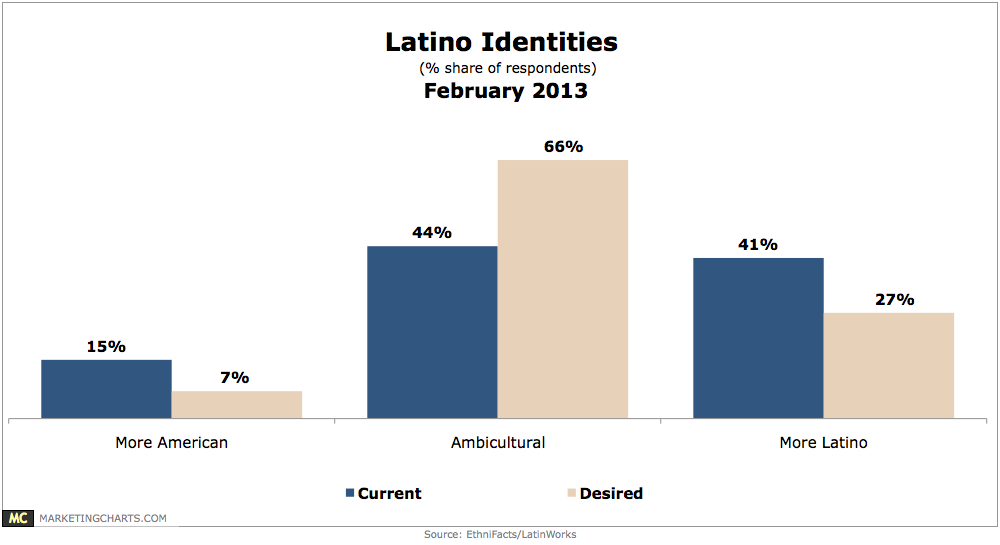
Latinos are increasingly aspiring to be equally Latino and equally American.
Read MoreMobile Operating System Market Share, 2011 vs 2012 [CHART]
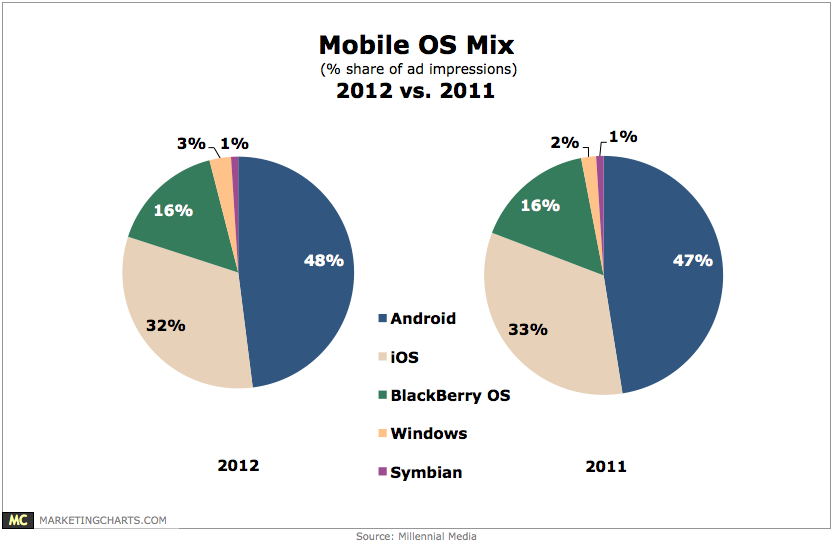
With 75% share of total ad impressions, the smart phone share grew by 7% points from 2011.
Read MoreAmericans' Most Popular Movie Genres [CHART]
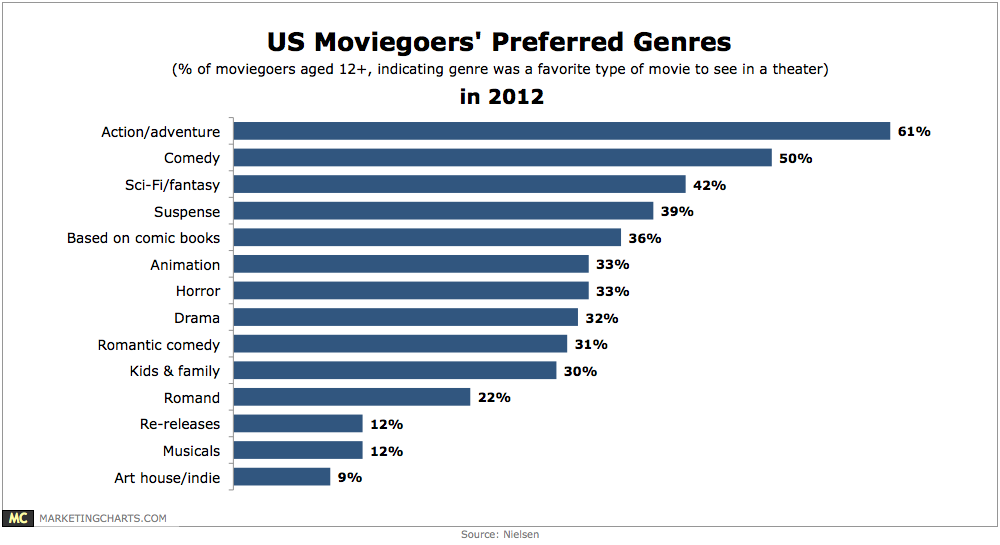
Asked the types of movies they like to see most in theaters, 61% of American moviegoers chose action and adventure flicks, with comedy (50%) rating as the second-most popular.
Read MoreSearch Advertising Cost Per Click By Device, Q4 2011 – Q4 2012 [TABLE]
US advertisers will increase mobile search ad spending 80.6% this year to $3.54 billion, up from $1.99 billion in 2012.
Read MoreInteraction With Brands Via Social Media By Generation, February 2013 [CHART]
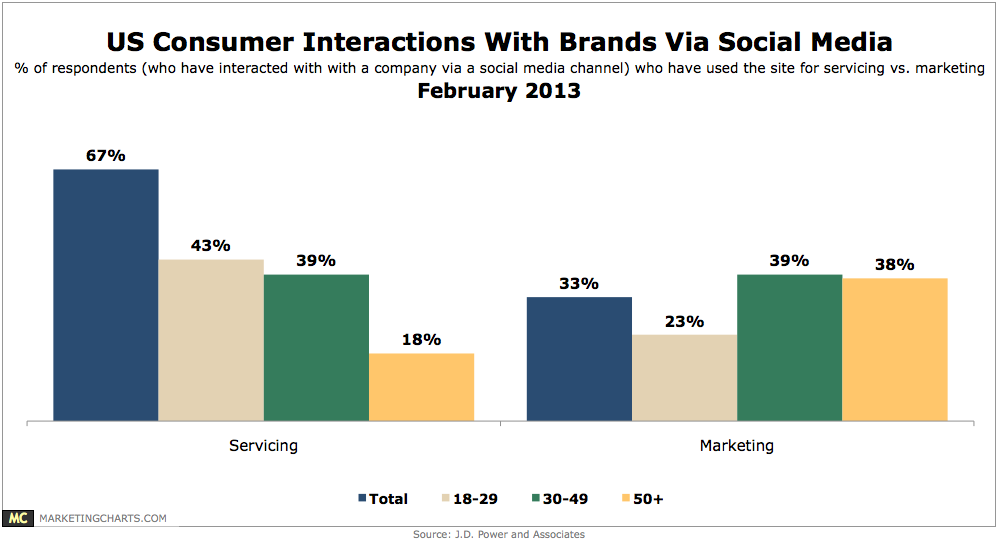
67% of people have have interacted with a company via a social media channel for servicing versus 33% who have done so for marketing.
Read MoreFacebook Pages Benchmarks [INFOGRAPHIC]
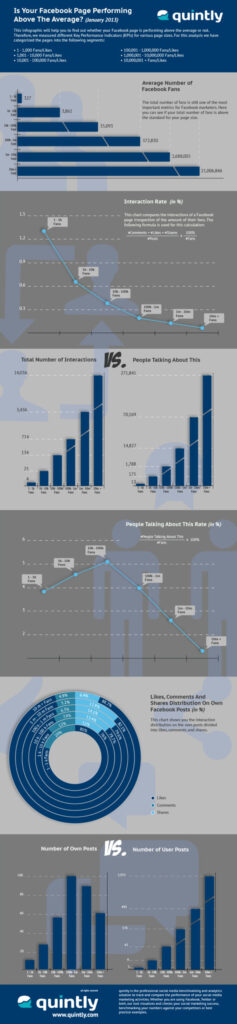
This infographic by Quintly analyzes Facebook metrics to provide benchmarks for pages of all sizes.
Read MoreTop Channels For Local Marketing Success, February 2013 [CHART]
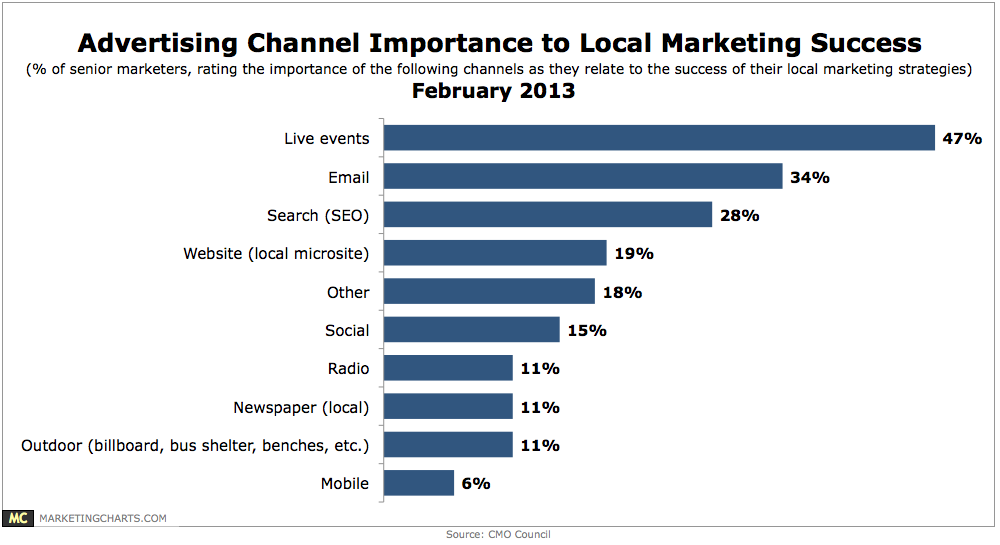
Senior marketers are lukewarm about mobile’s importance to their local marketing agendas.
Read MoreVideo Engagement: Facebook Uploads vs. YouTube Links, January 2013 [CHART]
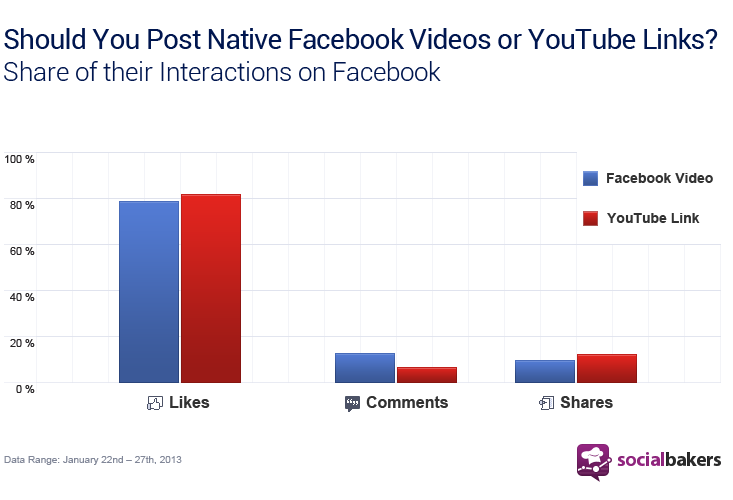
Facebook videos achieved a 40% higher Engagement Rate (0,25%) than YouTube links (0,151%) in the studied period.
Read MoreOnline Travel Spending, 2012 [TABLE]
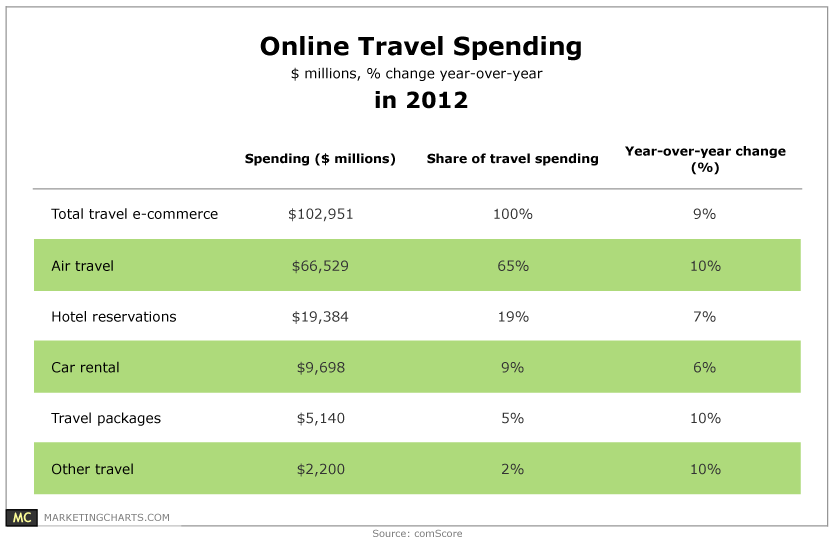
US travel e-commerce sales exceeded $100 billion for the first time last year, reaching $103 billion.
Read MoreGetting Facebook Shares [INFOGRAPHIC]
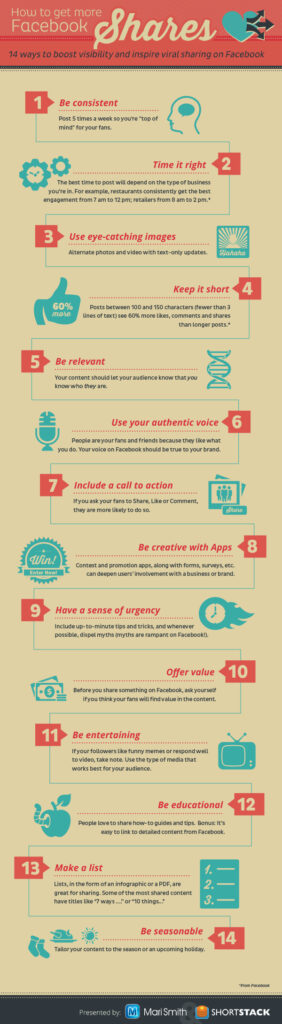
This infographic by Mari Smith illustrates fourteen tactics to inspire people to share your content on Facebook.
Read More