Consumer Behavior
Percent Of Top 100 Global Brands On Social Media, November 2012 & February 2013 [CHART]
Adoption by the Top 100 brands of social media rose five percentage points (54% to 59%) from November 2012 to February 2013.
Read MoreGlobal mCommerce Activities, February 2013 [CHART]
24% of American smart phone users surveyed during Q2 2012 reported scanning a barcode or QR code in the previous 30 days.
Read MoreTime Spent Watching Long Online Videos By Device, Q4 2012 [CHART]
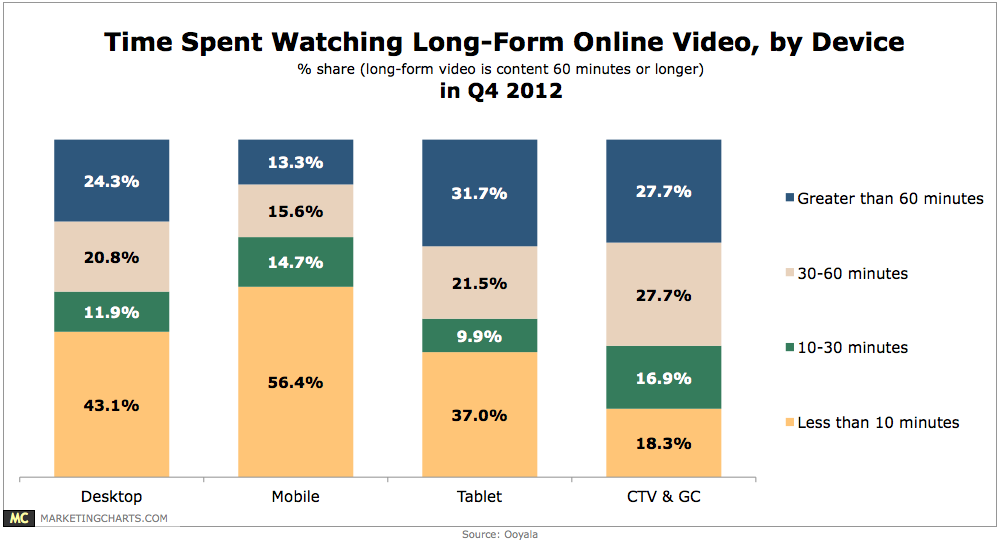
In Q4 2012, 53.2% of time spent watching tablet video was with content running at least a half-hour in length.
Read MoreCost per Loyal Mobile App User Index, June 2012 – January 2013 [CHART]
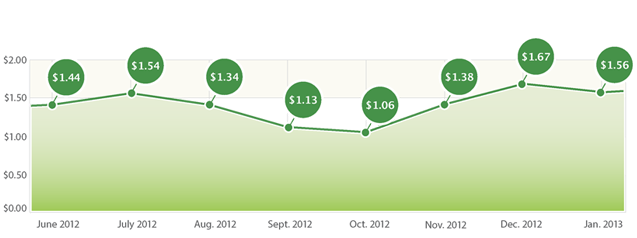
The Cost per Loyal Mobile App User Index measures the cost of acquiring a loyal user for brands who proactively market their apps.
Read MoreApp Store Competitive Index, June 2012 – January 2013 [CHART]
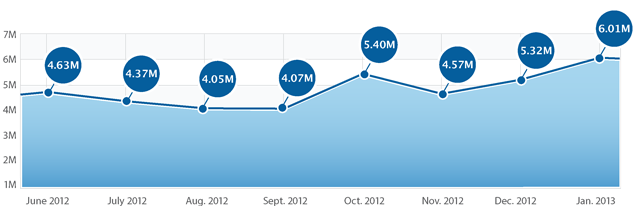
The App Store Competitive Index continued to climb by 6.01 million daily downloads, up 13 percent from December’s 5.32 million.
Read MoreTrusted Sources Of Online Health Care Treatment Information, February 2012 [TABLE]
The websites of physician groups or medical practices were US internet users’ most trusted sources for health care treatment information.
Read MoreTop 5 Types Of Scarce Health Care Information For American Seniors, March 2012 [CHART]
Half of the US seniors it surveyed in March 2012 felt there wasn’t a single online resource where they could find highly credible health information.
Read MoreFrequency With Which American Moms Use Online Channels For Health Content, January 2012 [CHART]
In January 2012 that nearly one-third of moms searched the internet for health information once a day or every few days.
Read More