Consumer Behavior
Top Motivations For Shopping Online, March 2013 [CHART]
Asked to identify the top-3 improvements to their online shopping experiences that would motivate them to shop more, 74% of consumers cited free delivery.
Read MoreConsumer Attitudes Toward Interacting With Companies Online By Generation, December 2012 [TABLE]
Roughly 40% of consumers under 55 (and 54% of consumers over 55) agreed that “companies that listen online are intruding on customers.”
Read MoreAmericans Who Expect Companies To Listen To Them Online By Generation, December 2012 [CHART]
Millennials between 18 to 24 years old were least likely to be aware of companies listening in, although still over three in five knew this went on.
Read MoreWomen Who Abandon Social Media, March 2013 [TABLE]
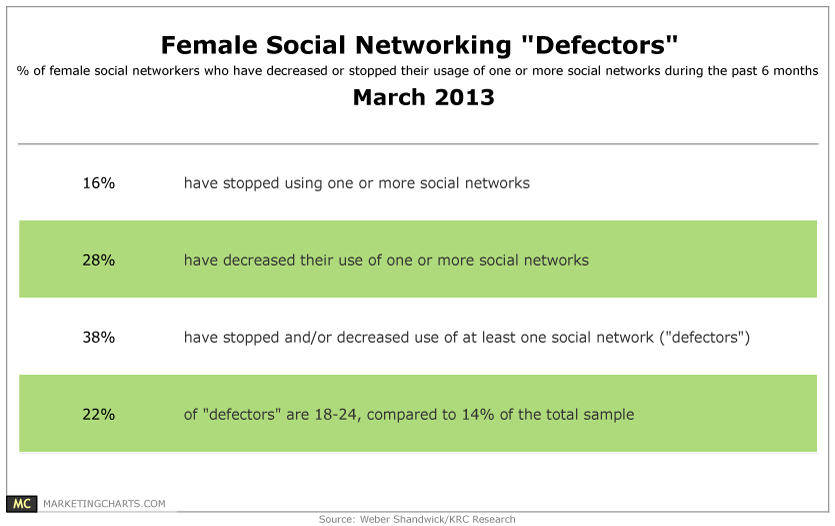
Among the 86% of North American women surveyed online who have a social media account, 38% are dubbed Defectors, who have stopped (16%) and/or decreased (28%) using at least one social network.
Read MoreImportance Of Buying American By Product Category & Gender, March 2013 [CHART]
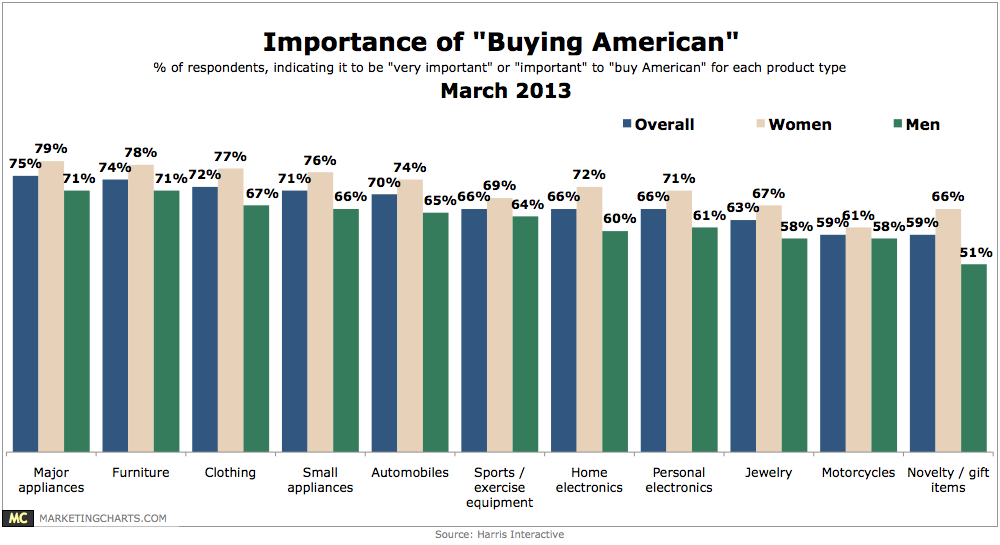
Women were 11% more likely to consider Buying American important when purchasing major appliances (79% vs. 71%).
Read MoreMinneapolis/St. Paul Experience 5th-Biggest Rise In Telecommuting Nationwide
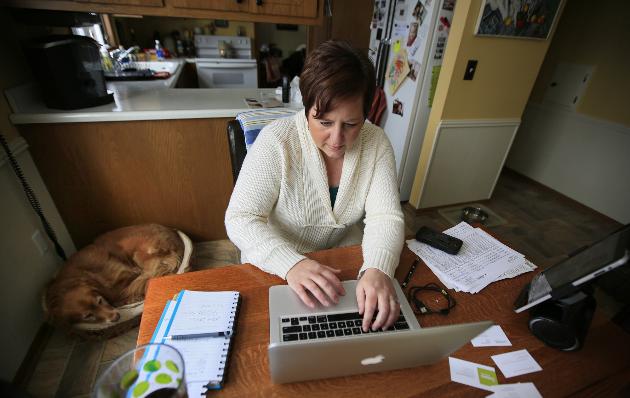
The Twin Cities has experienced the fifth-biggest rise among metro areas nationwide in the number of workers based at least partly at home.
Read MoreTwitter Sentiment vs Public Opinion, March 2013 [TABLE]
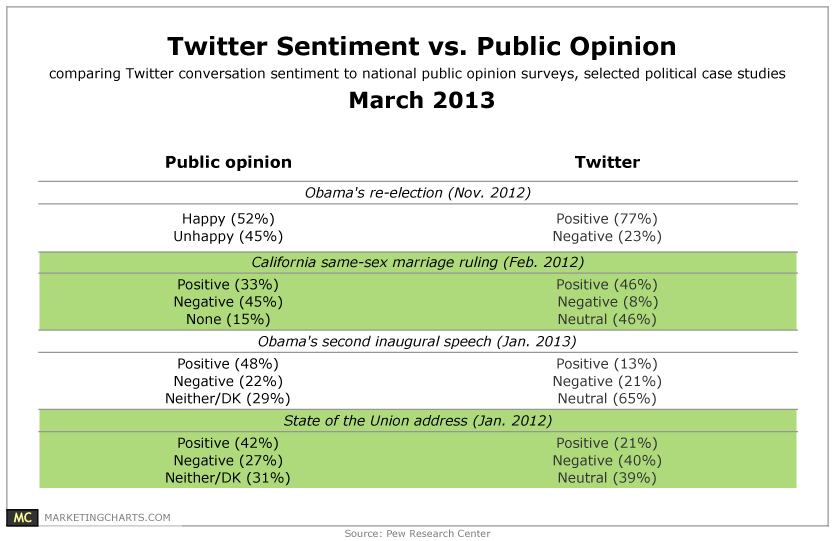
The Twitter conversation does not tend to be exclusively more liberal or conservative than general public opinion, but it does seem to be quite negative at points.
Read MorePromoted Tweet Campaign Results, March 2013 [TABLE]
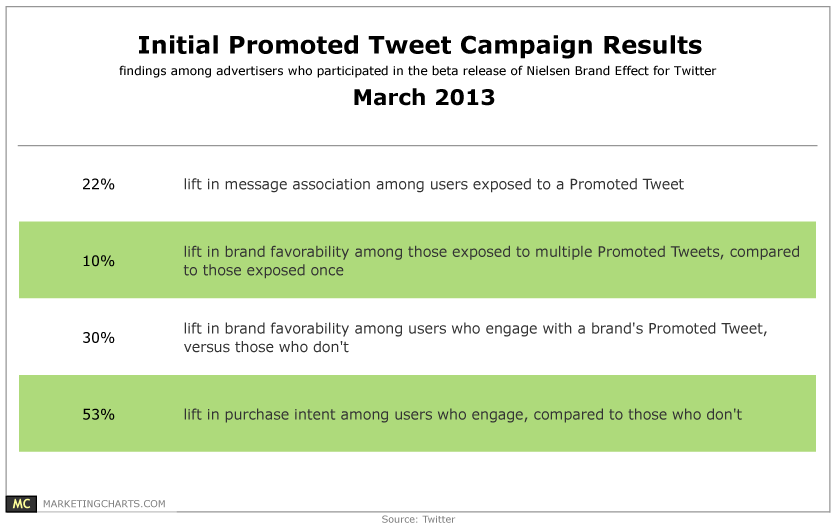
Users exposed to a Promoted Tweet impression had an average 22% higher message association than those not exposed to Promoted Tweets.
Read MoreConversion Rates For American Visitors To Travel Websites By Category, January 2011 – March 2012 [CHART]
The monthly average for conversions via cruise sites was less than 1% between January 2011 and March 2012.
Read MoreSources That Influence Vacation Choice For US Cruise vs. Non-Cruise Travelers, April 2011 [TABLE]
While many cruisers turn to travel agents to book, only 11% considered agent recommendations as a purchase influence.
Read More