Consumer Behavior
Top Multi-Platform Properties, February 2013 [TABLE]
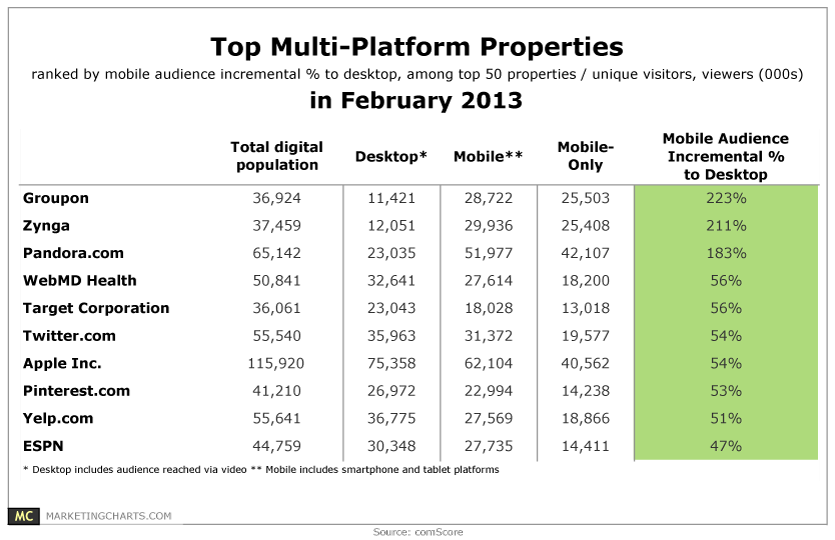
Including mobile audience counts into a web property’s total audience makes a significant difference to reach and rankings.
Read MoreWhere People Use Mobile Travel Sites & Apps, March 2013 [CHART]
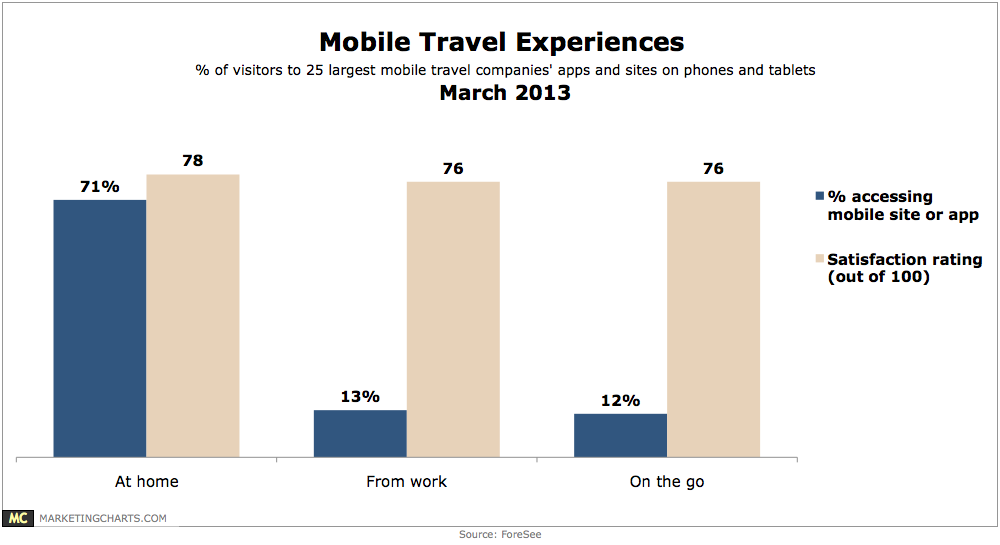
71% of consumers accessed travel companies mobile websites or apps from home, compared to 13% who accessed from work and just 12% who visited them on-the-go.
Read MoreMobile Website vs. App Traffic, March 2011-March 2013 [CHART]
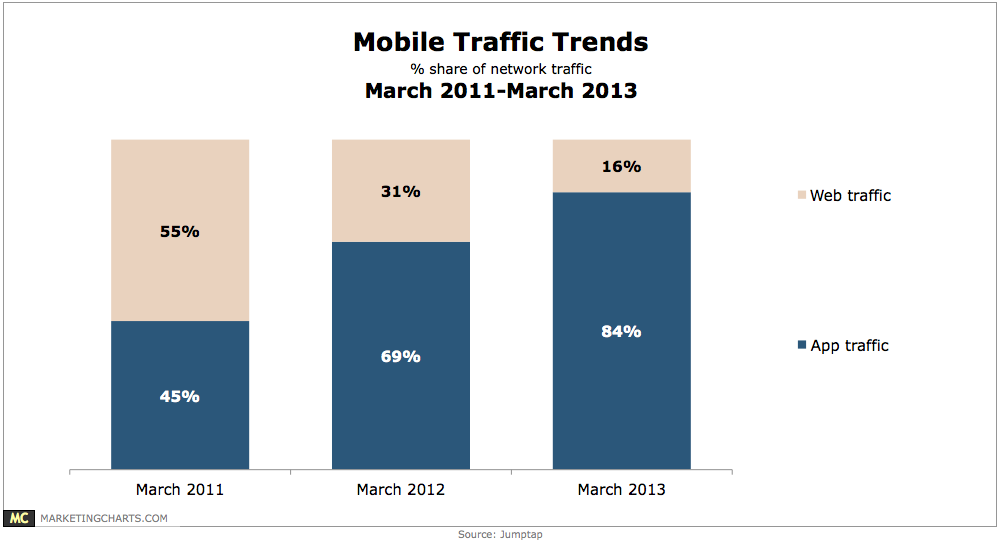
85% of mobile application users prefer them to the mobile web, primarily as a result of convenience and speed.
Read MoreUS Online Buyers By Generation, 2010-2016 [TABLE]
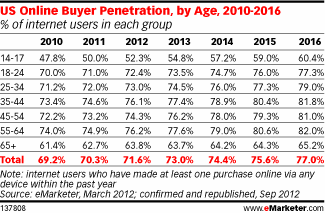
eMarketer’s estimate of online buyer penetration among internet users puts the figure at 63.7% for the 65-and-older population by the end of 2013.
Read MoreVideo Consumption By Platform & Generation, Q4 2012 [TABLE]
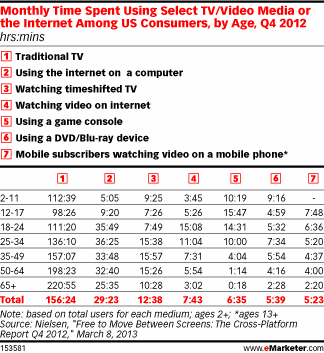
In Q4 2012, seniors averaged 220 hours and 55 minutes per month watching traditional TV.
Read MoreAmerican Seniors' Technographics [CHART]
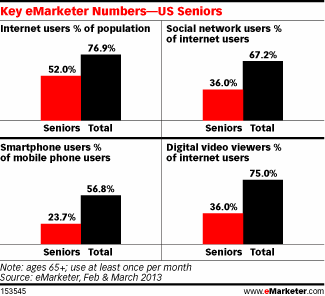
Although a majority of seniors have mobile phones, comparatively few have smart phones.
Read MoreTop News Sites By Facebook Interaction, September 2012 [CHART]
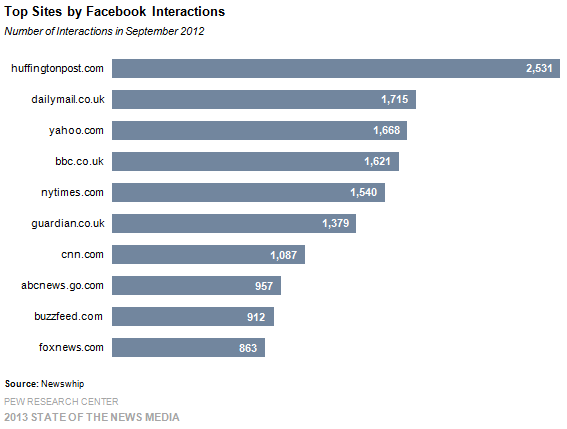
In terms of Facebook interactions, HuffPost beat out more traditional companies, such as The Daily Mail, The New York Times, and CNN.
Read MoreUS Television Ad Spending vs. Audience Growth, Q1 2011 – Q4 2012 [CHART]
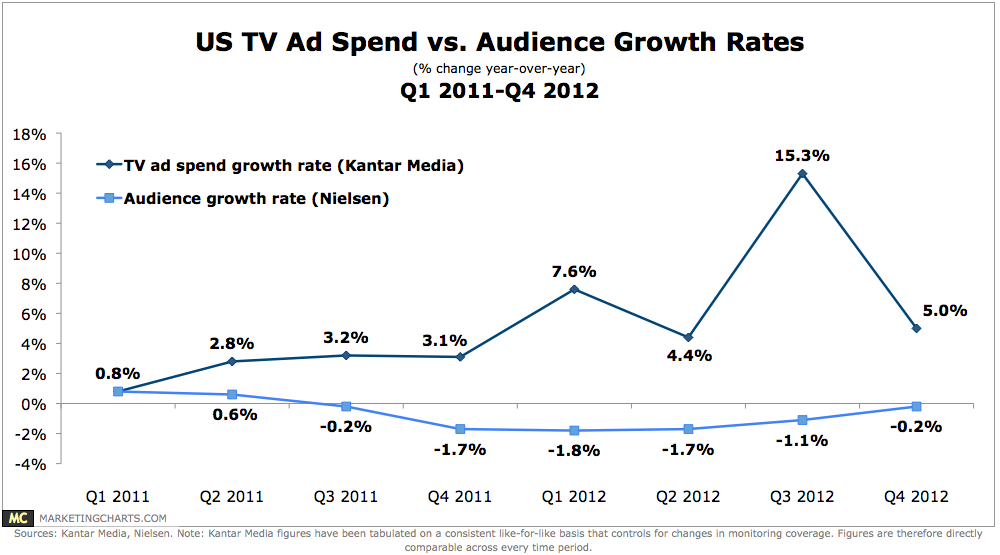
TV ad spending growth continues to be healthy even as its audience size declines.
Read More
Americans’ Favorite Media Activities By Generation, March 2013 [CHART]

64% of Americans rank watching TV (on any device) as one of their top-3 media activities, down from a high of 71% in 2009 and 2010 but enough to keep TV viewing as America’s favorite media activity.
Read More