Consumer Behavior
Click-Through Rates For Emails That Include Social Sharing, April 2013 [CHART]
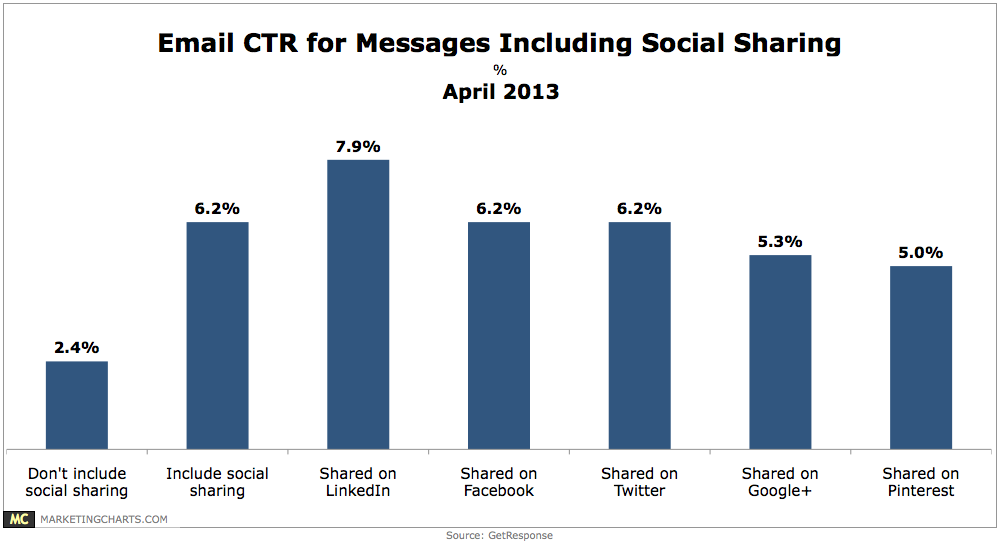
Emails that include social sharing buttons have a click-through rate 158% higher than those do not (6.2% vs. 2.4%).
Read MorePrimary Uses Of Hashtags, April 2013 [CHART]
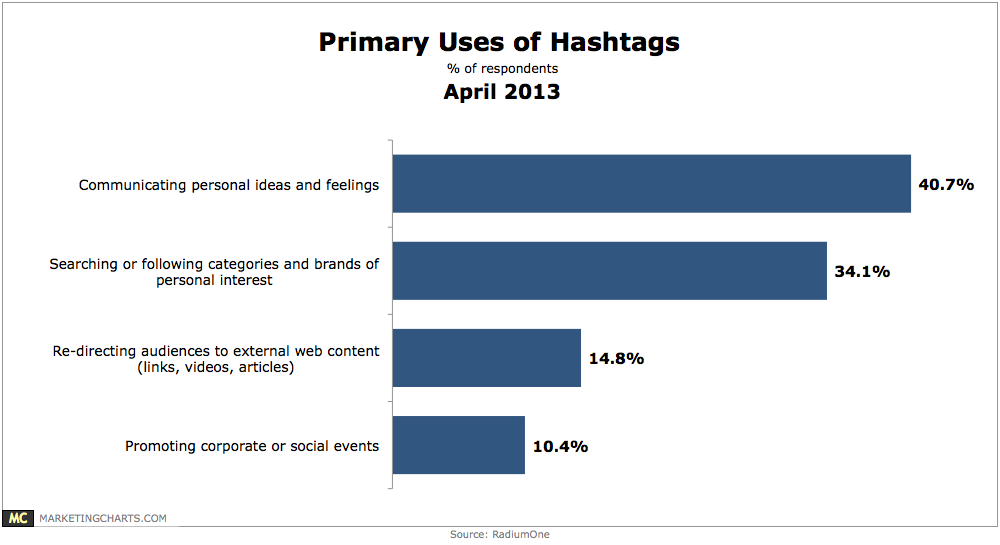
Hashtags are used primarily to communicate personal ideas and feelings (40.7%) and to search or follow categories and brands of personal interest (34.1%).
Read MoreSmart Phone Use To Begin The Day, March 2013 [CHART]
89% of 18-24-year-old smart phone owners reach for their device within 15 minutes of waking up, and 74% reach for it immediately after waking up.
Read MoreWhere People Consume Text & Video Content, March 2013 [CHART]
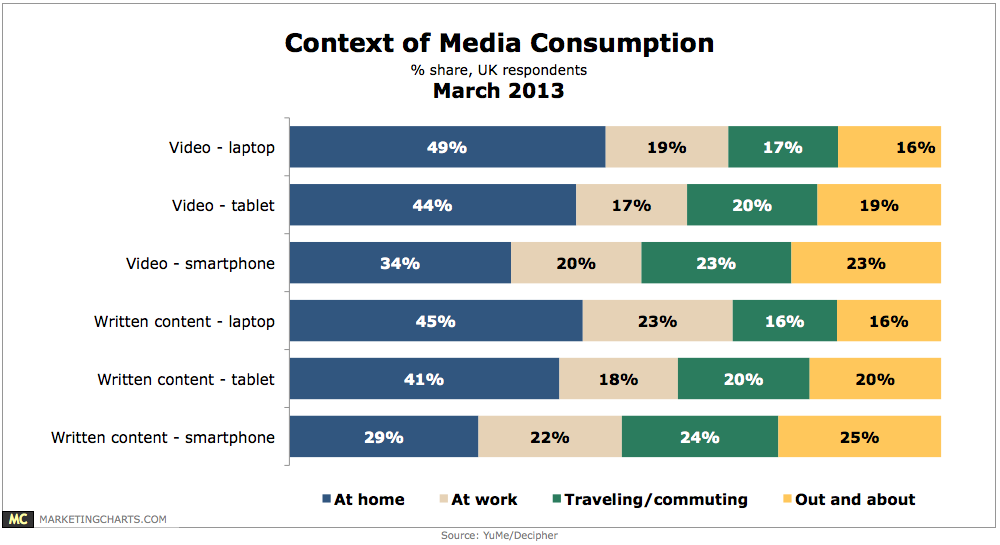
Regardless of device, consumption of videos takes place most often in the home and users are both more relaxed and explorative while at home.
Read MoreParents & Family Entertainment Spending, March 2013 [TABLE]
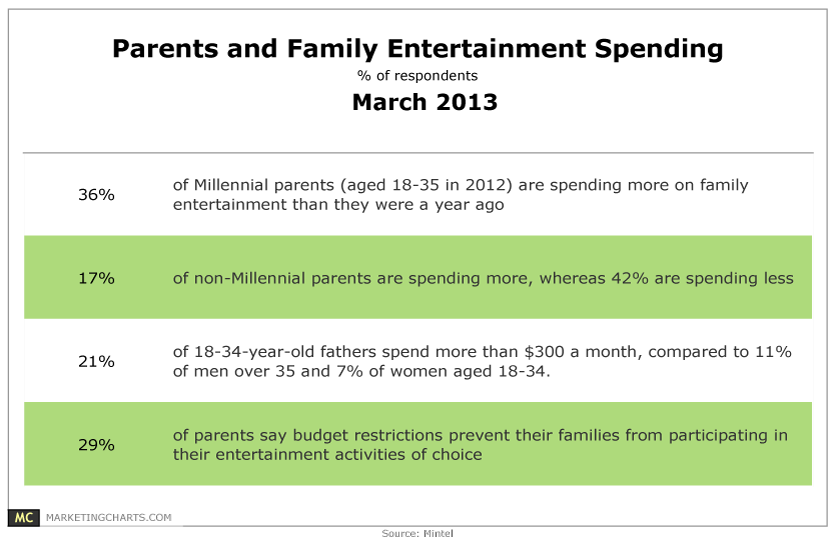
Millennial (18-35 in 2012) parents are twice as likely as non-Millennial parents to say they’re spending more on family entertainment than they were a year ago (36% vs. 17%).
Read MoreGoogle's Universal Search [INFOGRAPHIC]
This infographic from Search Metrics illustrates their study of Google’s Universal Search results.
Read MoreLocal Business Searches Resulting In Purchase By Device, March 2013 [CHART]

Almost 86 million people use their mobile phones to seek local business information in the US.
Read MoreNorth American Mobile Browsing By Daypart, March 2013 [CHART]
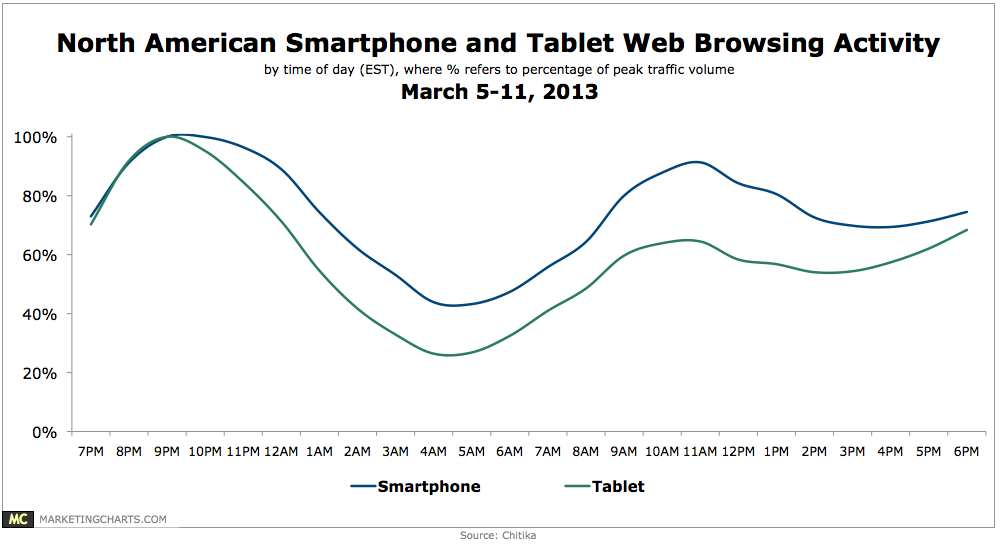
A study of web browsing by time of day shows that smart phone and tablet usage in North America peaks at 9 PM, whereas desktops reach their highest levels during the workday.
Read MoreFacebook Smart Phone Use By Weekday vs Weekend, March 2013 [CHART]
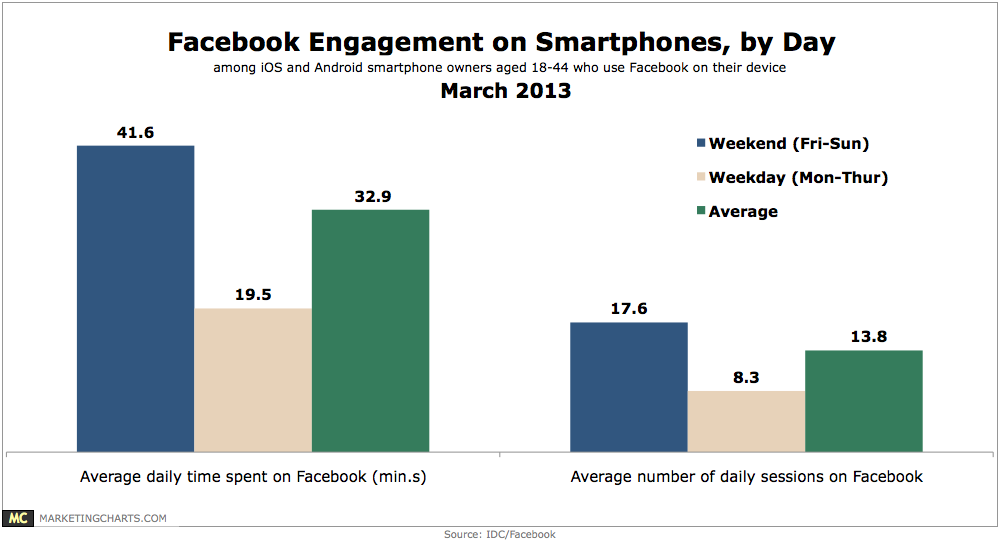
70% who use Facebook on their smart phone spend more than twice as much time doing so on the weekend (defined as Friday through Sunday) than on a typical weekday.
Read MoreNews Consumption Time By Device, March 2013 [CHART]
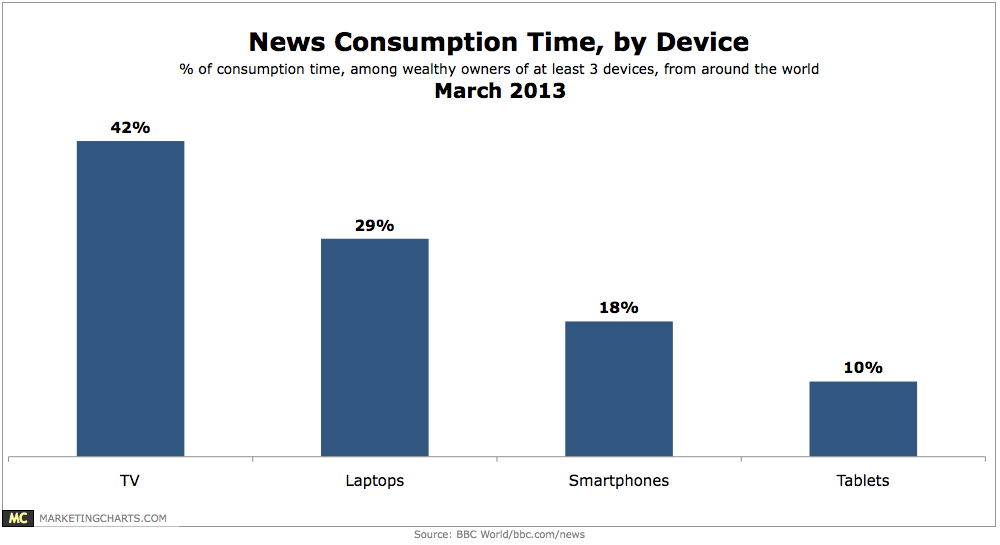
TV is still the primary device for news consumption, at 42% of respondents’ time, compared to 29% for laptops, 18% for smartphones, and 10% for tablets.
Read More