Consumer Behavior
Time Spent Consuming Media By Select Channels, April 2013 [CHART]
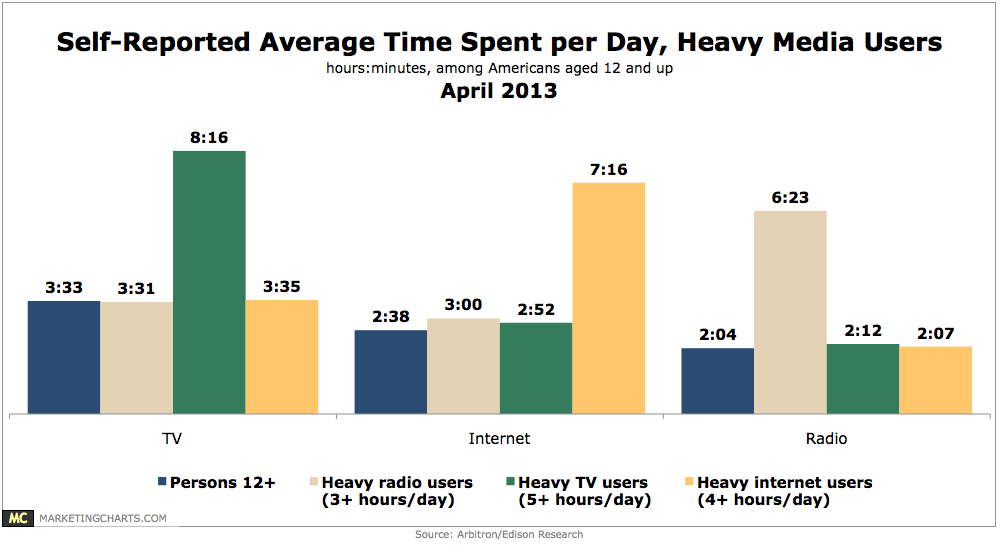
Heavy usage of one of the top 3 media (by reach) does not necessarily mean that less time is spent with the other media.
Read MoreTop Tablet Ad Models' Performance, April 2013 [CHART]
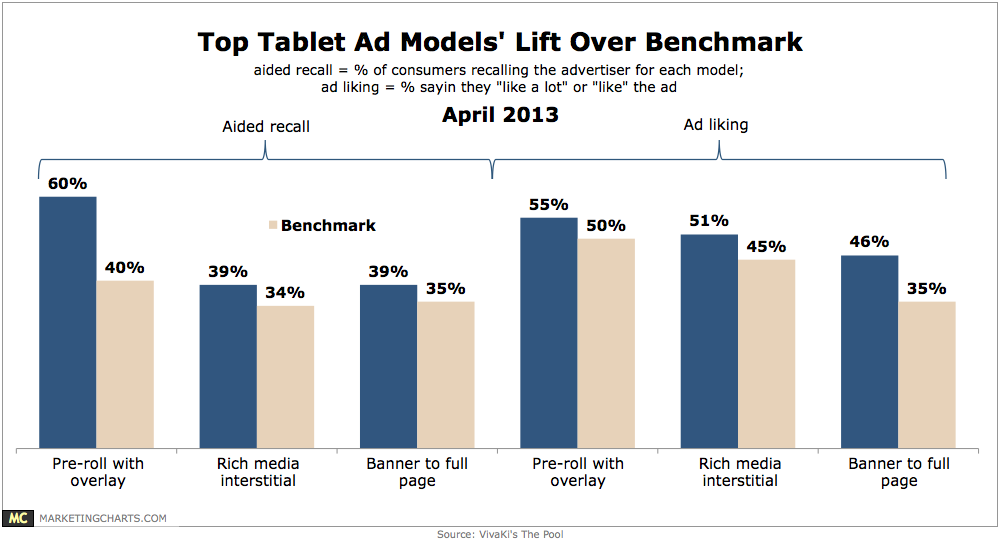
An exhaustive global study concludes that the top three tablet advertising models are pre-roll with overlay; rich media interstitial; and banner to full page rich media.
Read MorePreferred Social Logins, Q1 2013 [CHART]
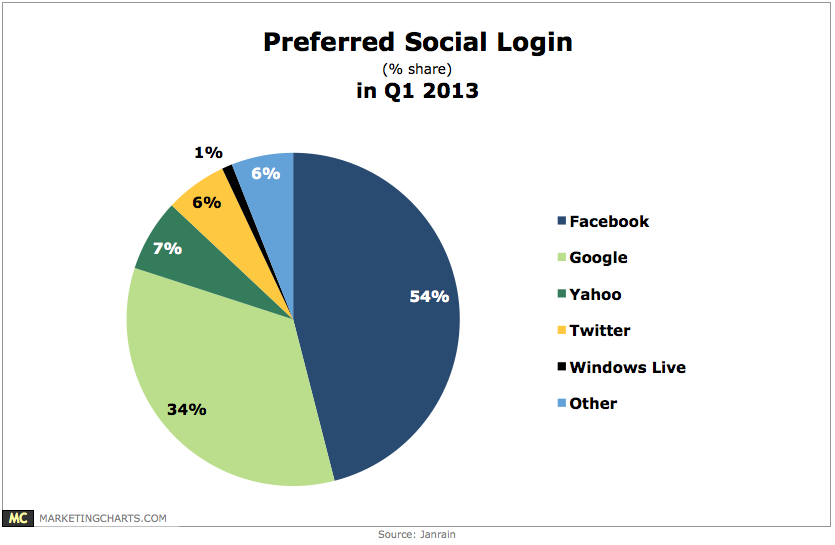
Facebook was once again the leading option in Q1 2013 for social logins.
Read MoreAnnoying Ads, April 2013 [CHART]
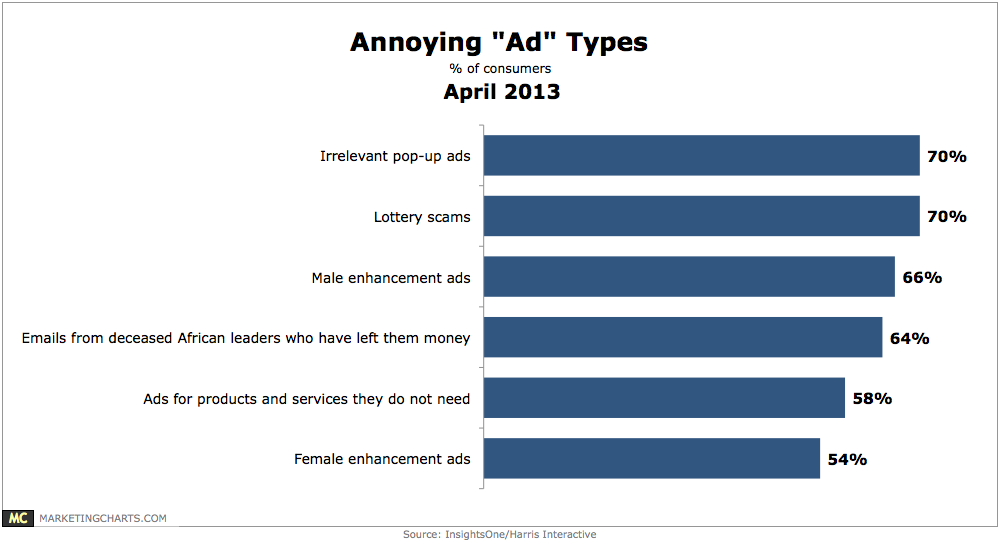
More Americans are annoyed by irrelevant pop-up ads (70%) than by male (66%) or female (54%) enhancement ads.
Read MoreMultiscreen Behavior With Facebook & Twitter By Gender, March 2013 [CHART]
Women were slightly more likely than men to turn to social media while watching TV, traveling and exercising, and significantly more likely to do so while shopping.
Read MoreMultiscreen Behavior With Facebook & Twitter, March 2013 [CHART]
More than eight in 10 Facebook users and about two-thirds of Twitter users used social networks while channel surfing.
Read MoreOnline Radio vs. Online Video Consumption, April 2013 [CHART]
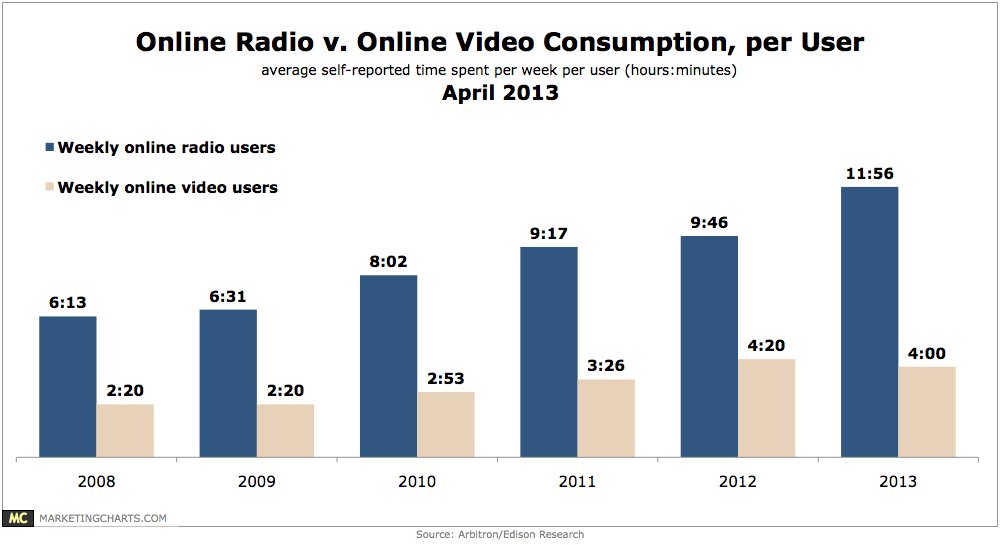
Online radio is far ahead of online video in terms of weekly consumption.
Read MoreTime Spent On iOS & Android Devices By Activity, April 2013 [CHART]
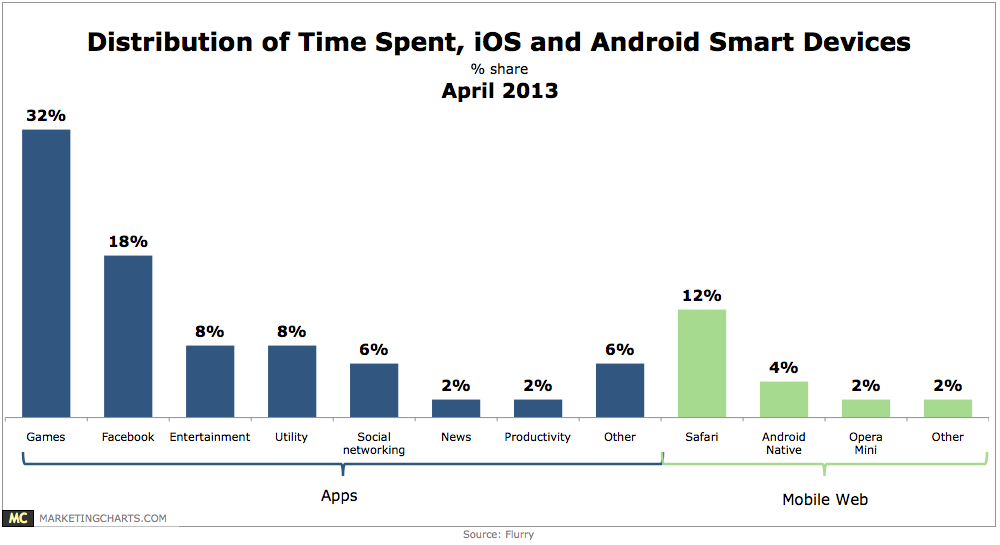
Android and iOS smart phone and tablet users spend an average of 2 hours and 38 minutes per day on their devices.
Read MoreSmart Phone Growth, October 2011 – February 2013 [CHART]
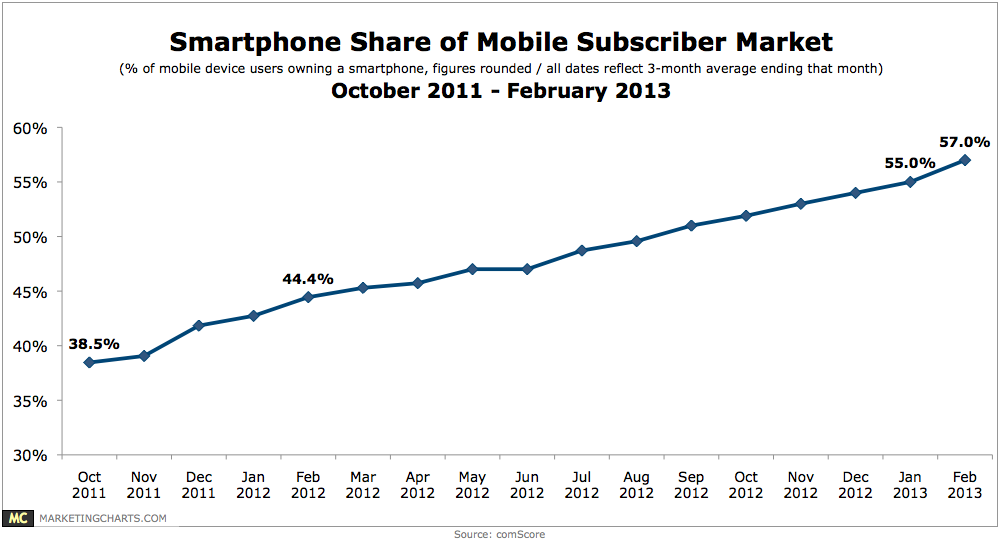
Smart phone penetration climbed to 57% of the US mobile market during the 3-month period ending in February 2013.
Read MoreConsumer Skepticism Of Environmental Messaging, April 2013 [CHART]
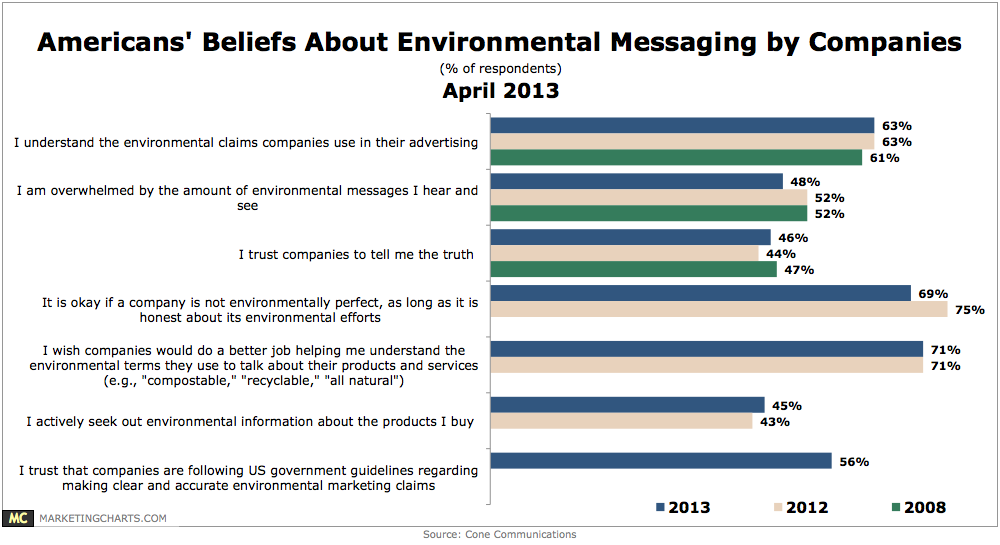
About 7 in 10 Americans at least sometimes consider the environmental impacts of the products they purchase when shopping.
Read More