Consumer Behavior
Marketing Input Consumers Would Give For $25, April 2013 [CHART]
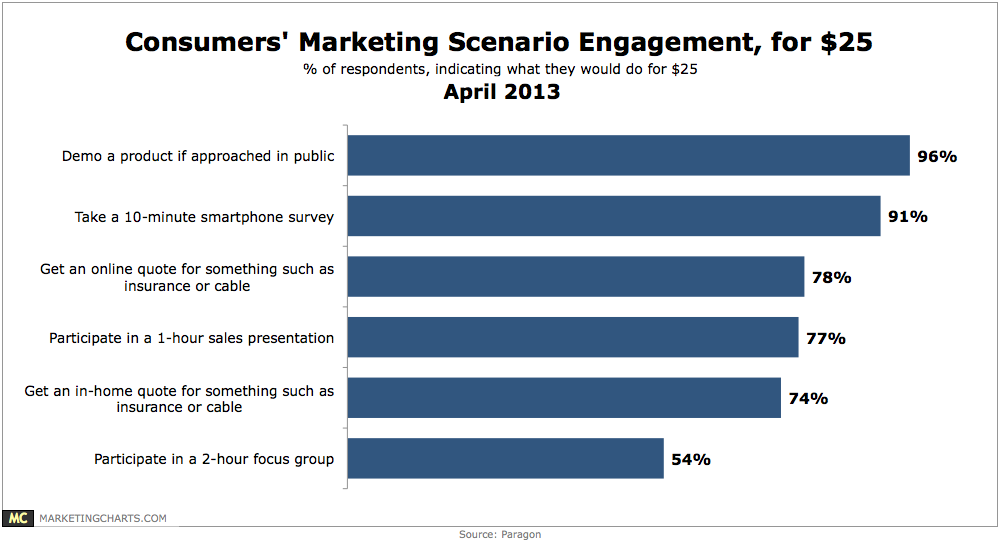
For $25, 96% of consumers would demo a product or service if approached in a public setting.
Read MoreDevices Use For Multitainment, 2012 vs 2013 [CHART]
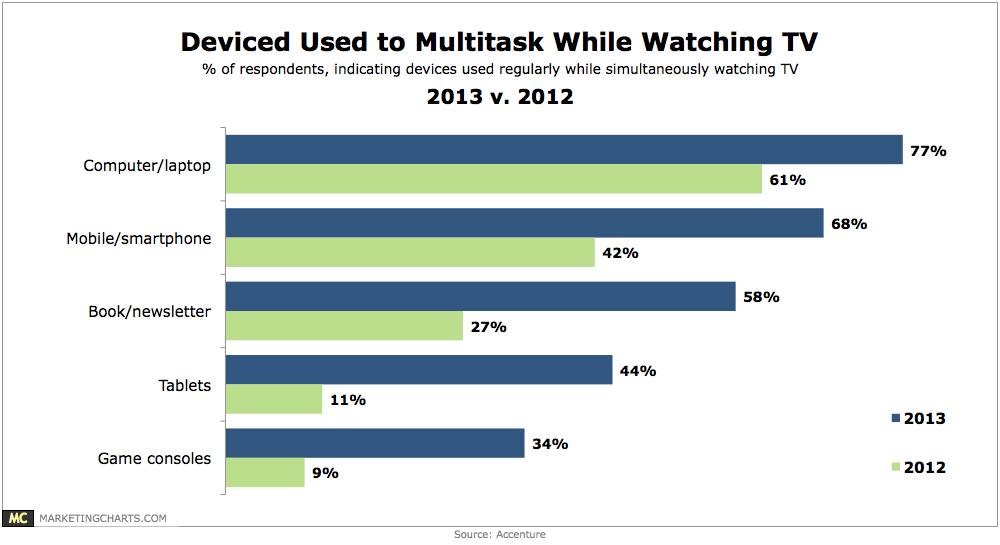
Regular use of tablets while watching TV (on a TV set) has soared from 11% in 2012 to 44% this year.
Read MoreTop Places New Vehicle Buyers Look For Product Information, August 2012 [CHART]
74% of US new-vehicle buyers surveyed used dealership websites, via desktop, mobile phone or tablet, during the buying process.
Read MoreMobile Search Behavior, April 2013 [TABLE]
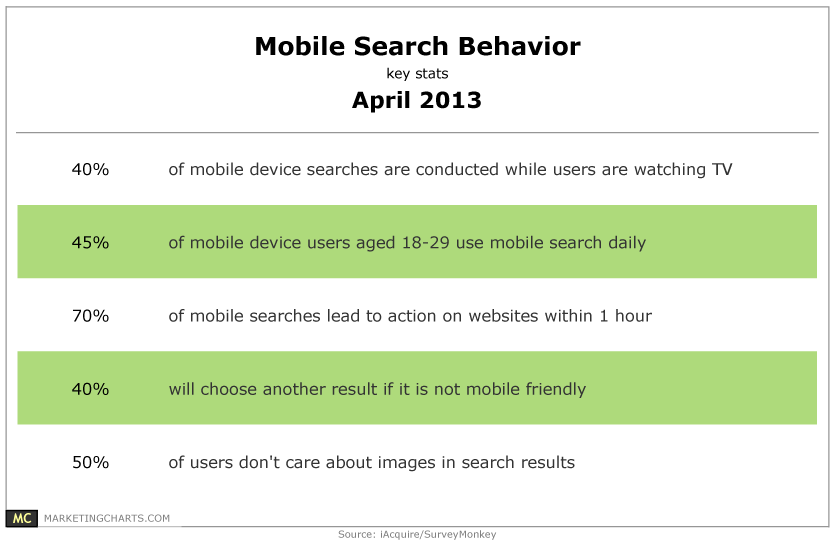
40% of mobile searches are conducted while users are watching TV.
Read MoreTop Sources For Coupons, April 2013 [CHART]
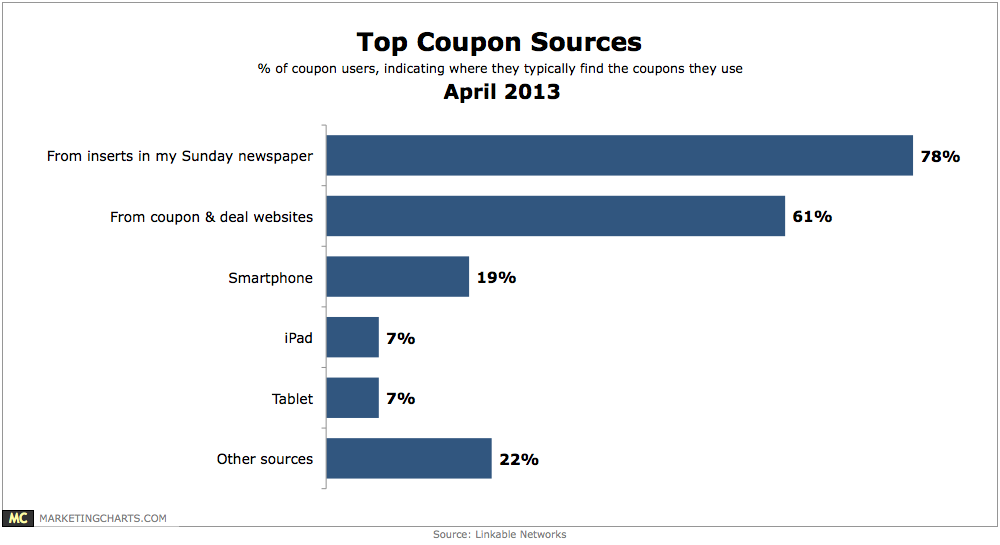
95% of consumers use coupons when they shop, including 30% who claim to do so every time they shop.
Read MoreSites Most Likely To Influence A Purchase, December 2012 [CHART]
Facebook was the social network most likely to influence purchases among US internet users surveyed by Technorati in December 2012.
Read MoreUS Social Commerce Metrics For Select Sites, 2012 [TABLE]
Even if fCommerce did not work out for plenty of retailers, they are still positive about the role Facebook plays in social commerce.
Read MoreSocial Media Tactics Used On US Retail Websites, Q4 2011 & Q4 2012 [TABLE]
98% of US eCommerce merchants surveyed had a Facebook page in Q4 2012, and nearly the same number of respondents (97%) linked to Facebook from their site.
Read MoreAmerican Cord Cutters, 2008-2013 [CHART]
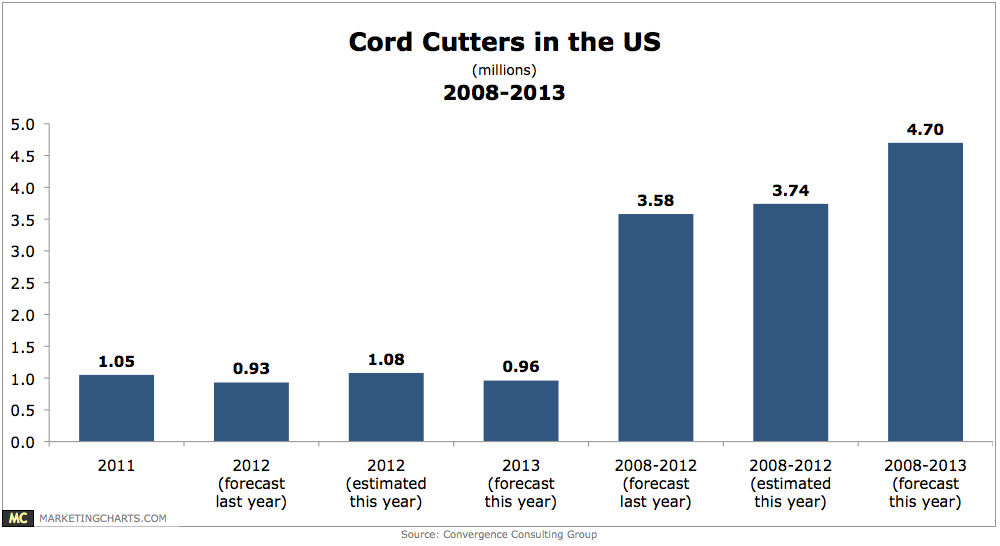
The number of American pay TV subscribers cutting the cord to focus solely on Netflix, over the air, online, and other sources is growing faster than expected.
Read MoreCumulative Life Spending By Race/Ethnicity, April 2013 [CHART]
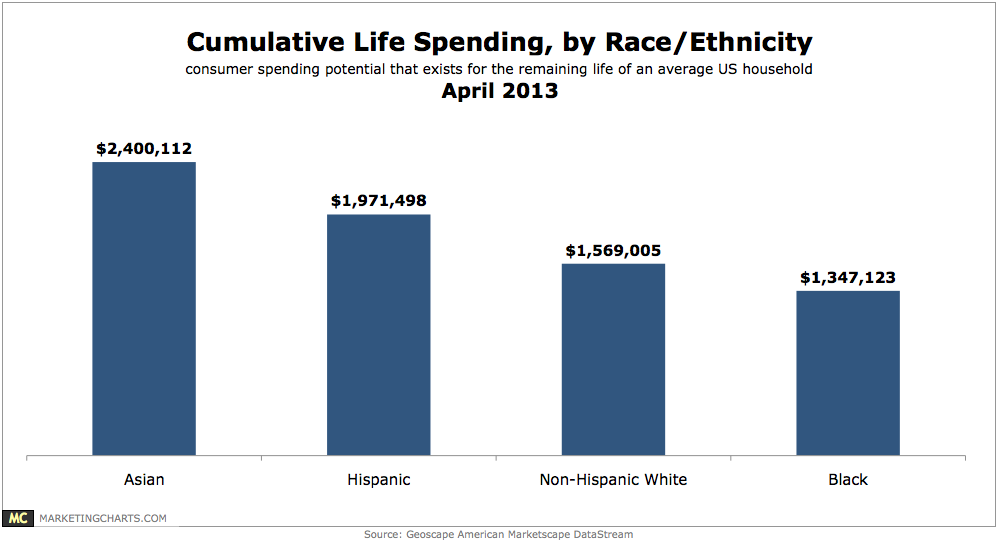
Asian and Hispanic households will outspend non-Hispanic White households in their lifetimes.
Read More