Consumer Behavior
Long-Term Impact Of Customer Experience, April 2013 [CHART]
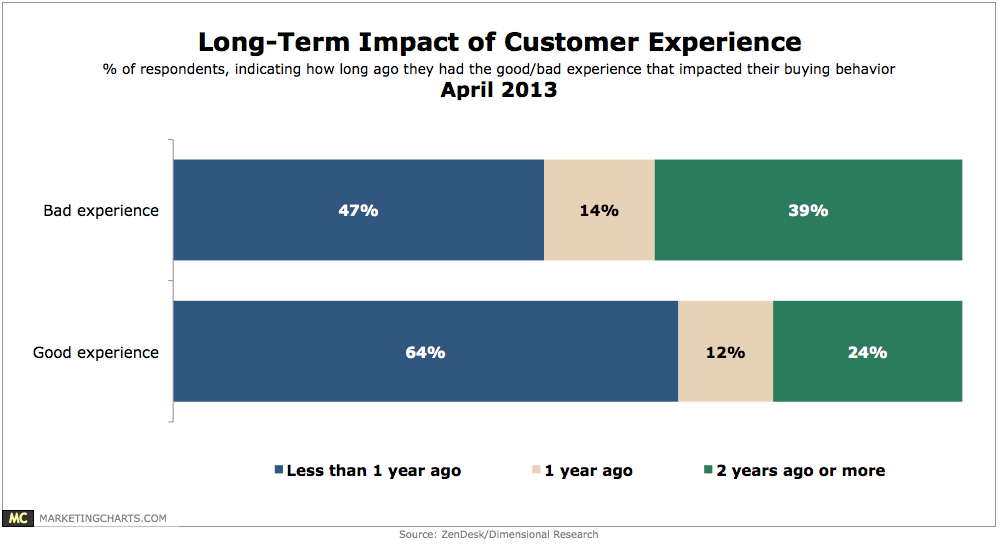
39% of respondents who had a bad experience with a company said their behavior was impacted for at least 2 years after the negative experience.
Read MoreRestaurants & Mobile Search Behavior, April 2013 [TABLE]
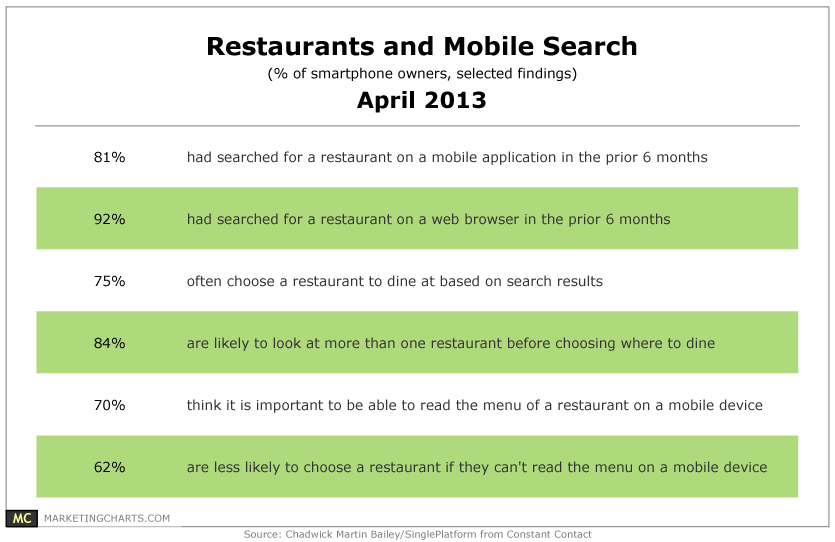
In the previous 6 months, 81% of respondents had searched for a restaurant via a mobile application, and 92% through a web browser.
Read More
Mobile Commerce App Usage By OS, April 2013 [CHART]
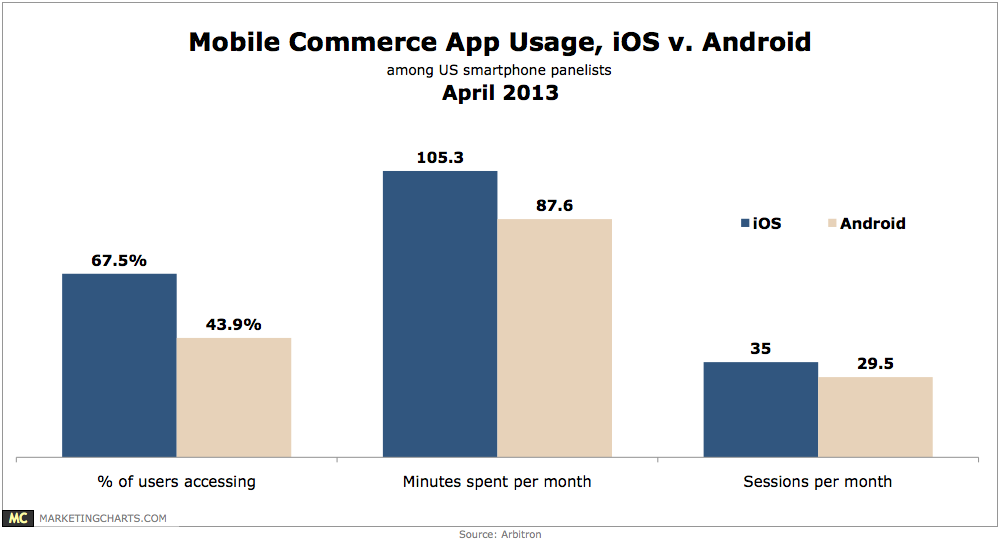
iPhone owners are 54% more likely than Android owners to use mobile applications for commerce.
Read MoreChallenges & Concerns About Using Social Media For Health Care Marketing, October 2012 [CHART]
Health care marketers worry about how to measure social media marketing efforts, especially tying the investment in social media directly to brand objectives.
Read MorePromotional Plans Of American Pharmaceutical & Biotech Companies, June 2012 [TABLE]
33% of pharmaceutical companies are digital beginners.
Read MoreAmericans Who Use Social Media For Health Needs, 2011 & 2012 [TABLE]
Roughly 45% of US adult consumers used social media for health-related purposes in 2012.
Read MoreWho People Share Customer Service Stories With, April 2013 [CHART]
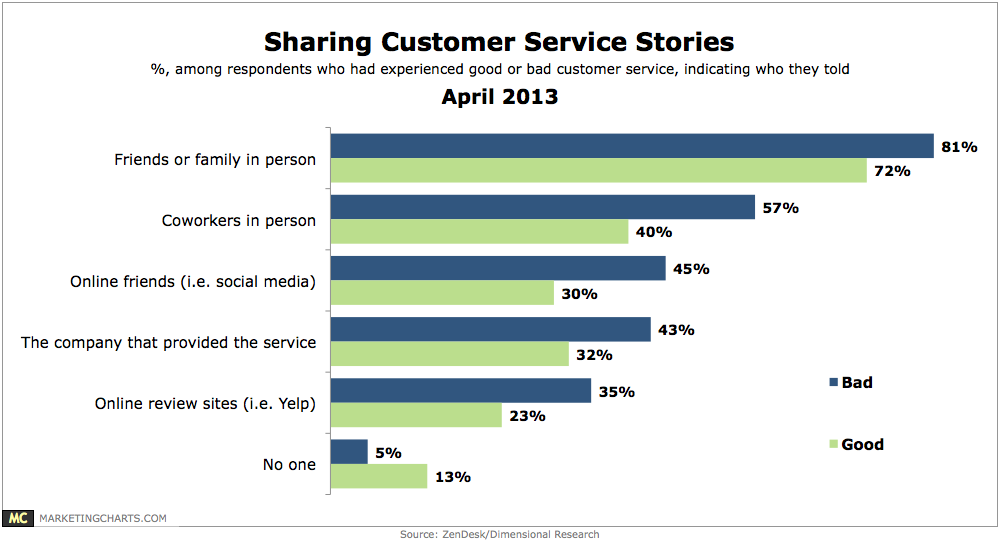
62% of B2B and 42% of B2C customers purchased more after a good experience, while 66% and 52% respectively stopped making purchases after a bad experience.
Read MoreBinge TV Viewing By Generation & Gender, April 2013 [CHART]
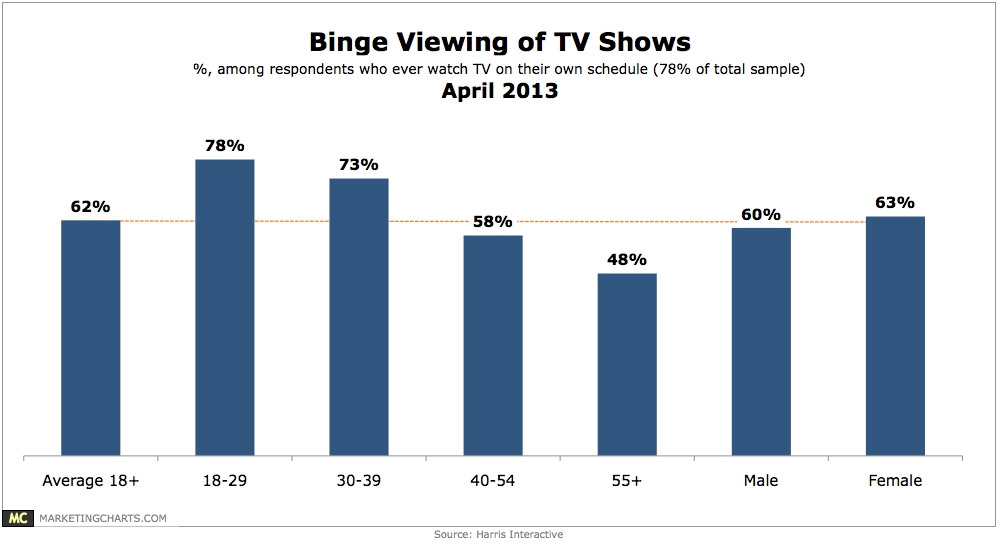
78% of Americans have watched TV on [their] own schedule and 62% of those have watched multiple episodes of a TV show at a time.
Read MoreWeekly Time Spent Using IM/Chat Apps By Mobile OS, April 2013 [CHART]
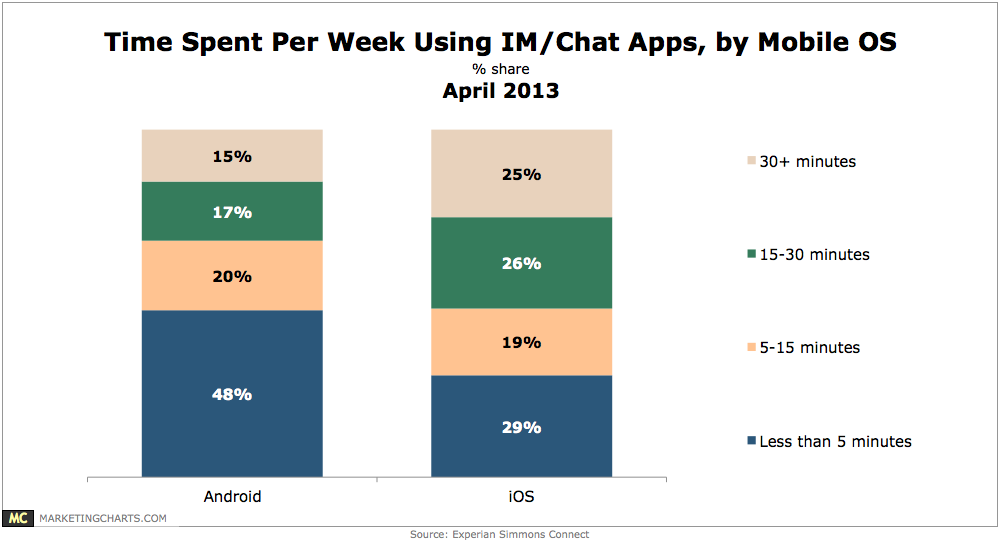
Android mobile owners are 2.4 times more likely than iPhone owners to use mobile IM/chat applications such as Whatsapp and Kik Messenger, but iPhone owners are heavier users of the apps.
Read More