Consumer Behavior
Senior Execs' Use Of Mobile, April 2013 [CHART]
Tablet adoption in particular has jumped, doubling in a year to 6 in 10 respondents, with use growing across all age groups.
Read MoreConsumer Attitudes Toward Store Brands, April 2013 [CHART]
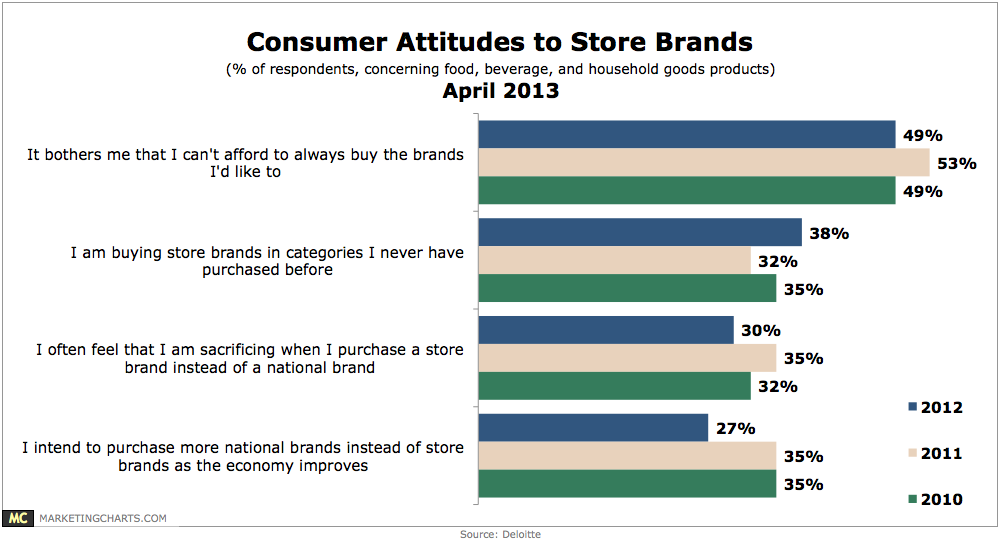
94% of Americans say they will remain cautious and keep their food, beverage and household goods spending at current levels even if the economy improves.
Read MoreMobile Share Of Online Video Starts, Q4 2011 vs Q4 2012 [CHART]
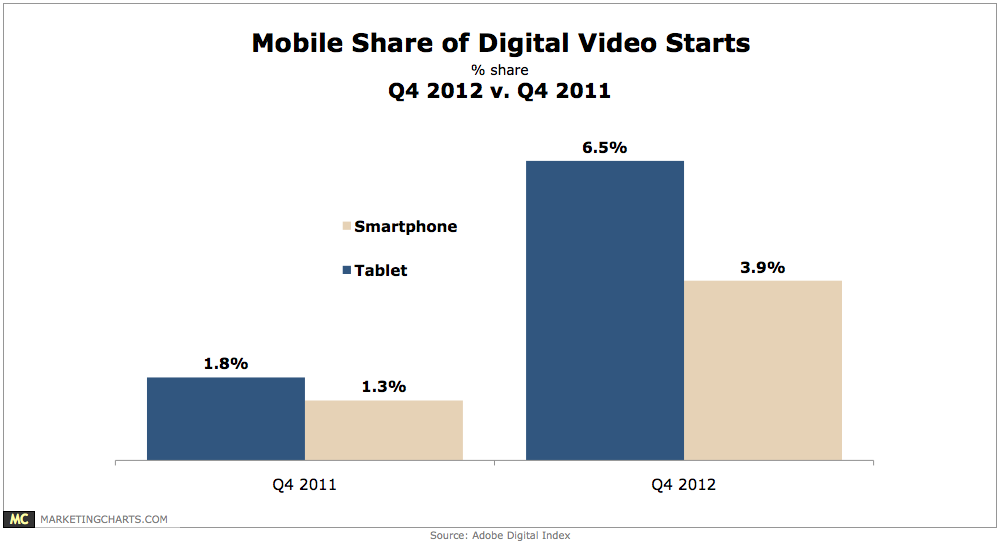
Smart phones and tablets accounted for a combined 10.4% of video starts, more than triple their 3.1% share from just a year earlier.
Read More
American Social Media Users By Race/Ethnicity, 2012-2017 [TABLE]
In 2012, 68.9% of Hispanics were using social networks, compared with 66.2% of the total US population.
Read MoreTime Spent Online By Activity, 2011 & 2012 [TABLE]
On the desktop internet, activity was much more heavily weighted toward social networking, which accounted for 27% of time spent online.
Read MoreTime Spent On Mobile Device Online By Activity, Q1 2013 [TABLE]
US mobile internet users spent the greatest percentage of their mobile web time using email, a 23% share of time spent vs. only 5% of time spent on desktop.
Read MoreDevices Used To Go Online, July 2011-January 2013 [CHART]

On average, 43.5% of participants accessed the internet via a mobile phone each week during the period ending in January 2013, an 8-percentage-point increase over the period ending in July 2012.
Read MoreAmerican Retail eCommerce Sales CAGR By Category, 2012-2017 [CHART]

A mix of larger and smaller online product categories will post the highest CAGRs from 2012 to 2017.
Read MoreAmerican Retail eCommerce Sales By Product Category, 2011-2016 [TABLE]
Computer and consumer electronics, as well as apparel and accessories, account for the bulk of US retail eCommerce sales.
Read More