Consumer Behavior
Change In Facebook Users' Activities By Device, Q1 2013 [TABLE]
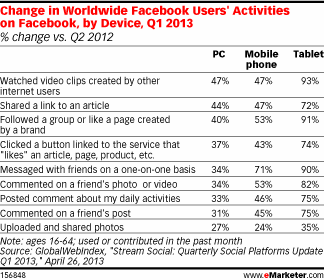
Watching videos on Facebook saw among the biggest jumps in usage, with viewing increasing by 47% on both PC and mobile, and nearly doubling on the tablet.
Read MoreHow People Watch TV, May 2013 [CHART]

An average of just 44% of viewing of full-length TV shows is live.
Read MoreReasons People Listen To AM/FM Radio, May 2013 [CHART]
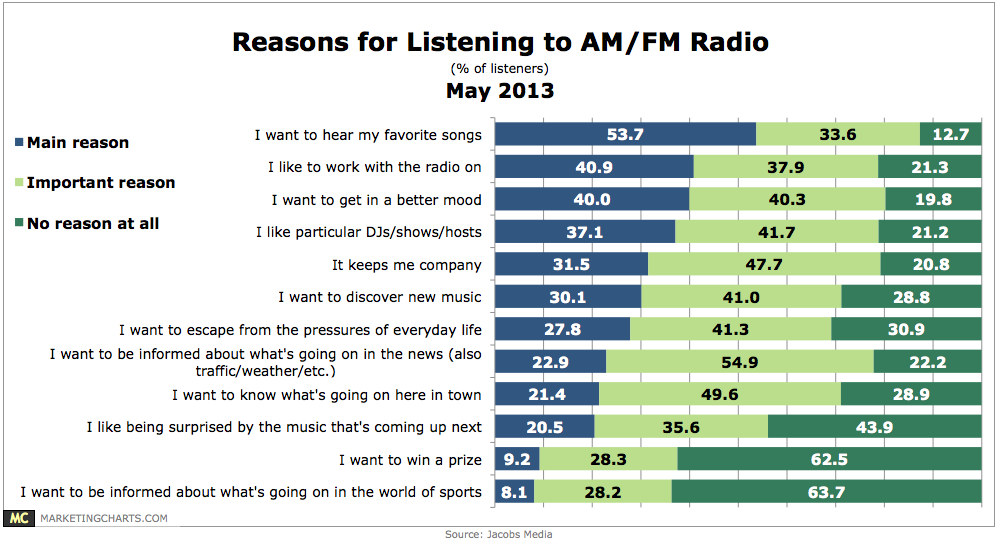
40% said a main reason for listening to AM/FM radio is to get in a better mood, with another 40% citing this as an important reason.
Read MoreAmericans' TV & Video Media Consumption By Generation, Q2 2012 [TABLE]
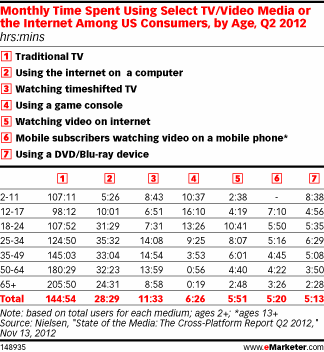
In Q2 2012, the average US mobile subscriber spent 5 hours and 20 minutes per month watching video on a mobile phone.
Read MoreBranded Vines More Likely To Be Shared Than Branded Videos [VINE]
According to a survey conducted by Unruly, branded Vines are four times more likely to be shared than branded videos and five Vine tweets are sent every second.
Read MoreNorth Americans' Spending Intentions, May 2013 [CHART]
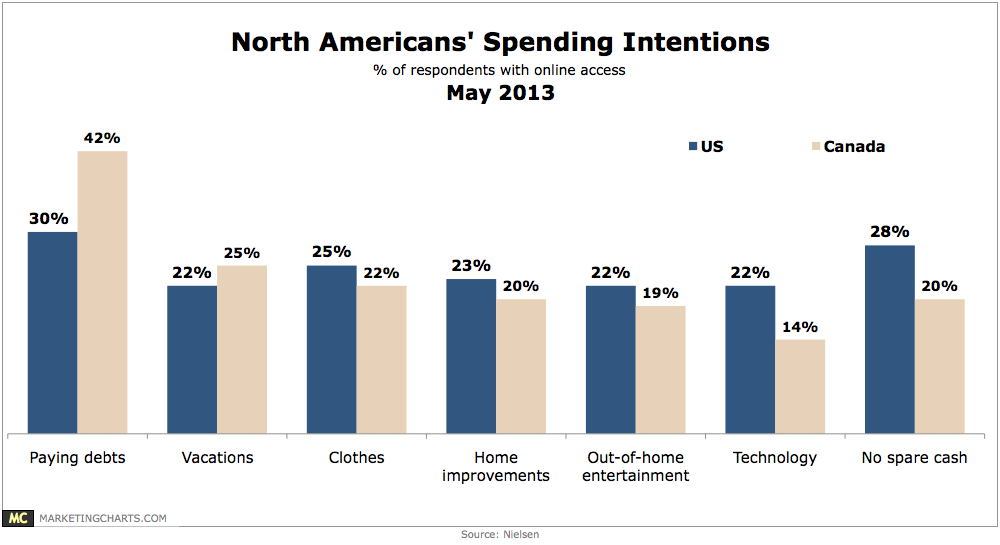
North Americans plan to spend on discretionary items this year, up from 36% the previous quarter.
Read MoreSecurity Measures Not Taken By Smart Phone Owners, May 2013 [TABLE]
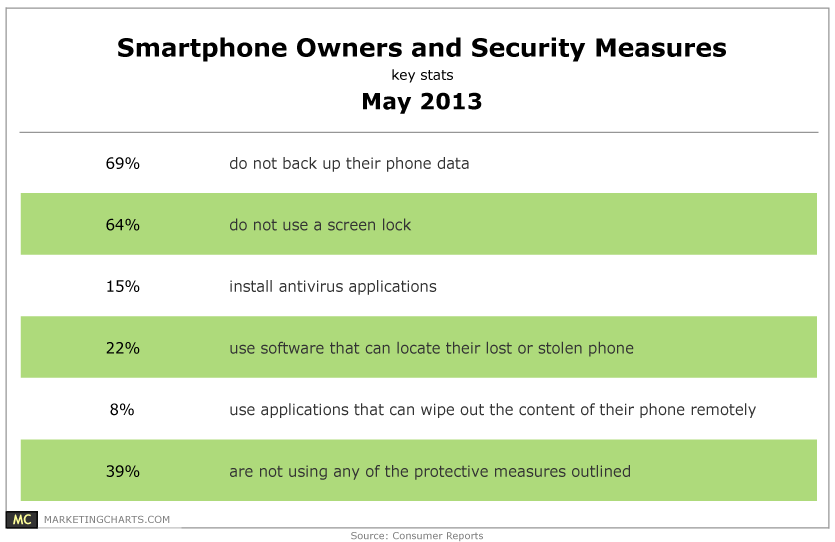
Only 22% of smart phone users have installed an application to locate a missing phone.
Read MoreFinancial Pros' Top Business Uses Of Social Media, Q1 2013 [TABLE]
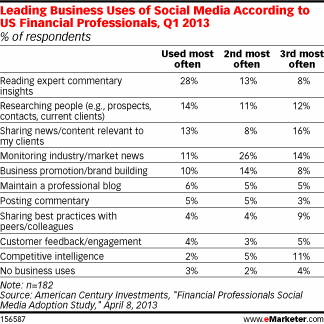
Financial professionals also reported turning to social media most often in order to read up on commentary and expert insights on the finance world.
Read MoreFinancial Pros' Use Of Social Tools For Business & Pleasure, Q1 2013 [TABLE]

One-third of respondents said they used LinkedIn only for business purposes, compared with 2% of Facebook users and 3% of respondents on Twitter.
Read MoreRadio Listeners' Social Media Use, May 2013 [CHART]
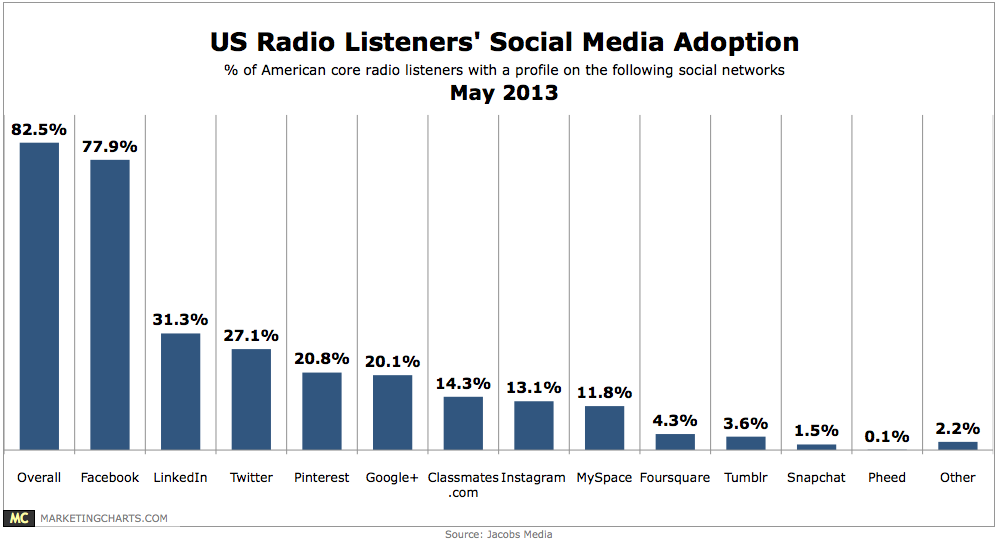
83% of radio listeners in the US have a profile on a social networking site.
Read More