Consumer Behavior
Experience With New Online Marketing Tactics, December 2012 [CHART]

Nearly 70% of respondents described their experience level with responsive design as average or better.
Read MoreUK Customer Service & Loyalty, May 2013 [TABLE]
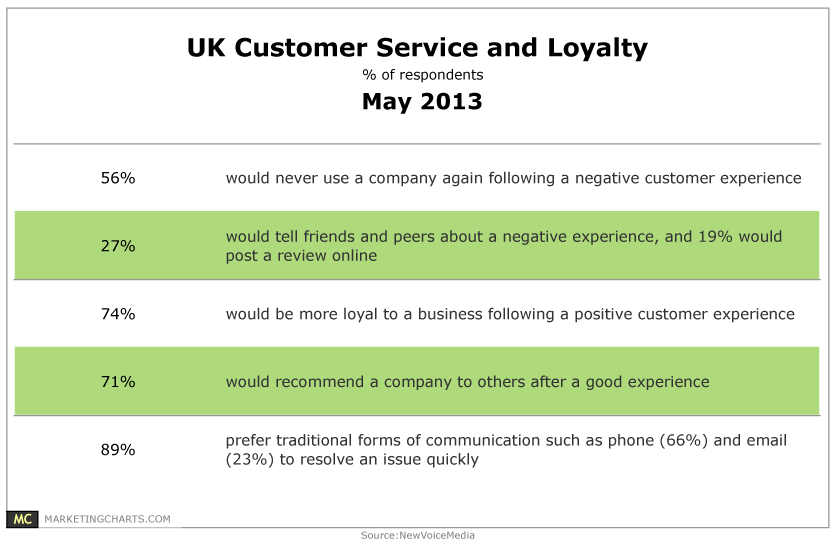
56% of UK consumers say they would never use a company again if faced with a negative customer service experience.
Read MoreAmericans & On Demand Entertainment, May 2013 [TABLE]
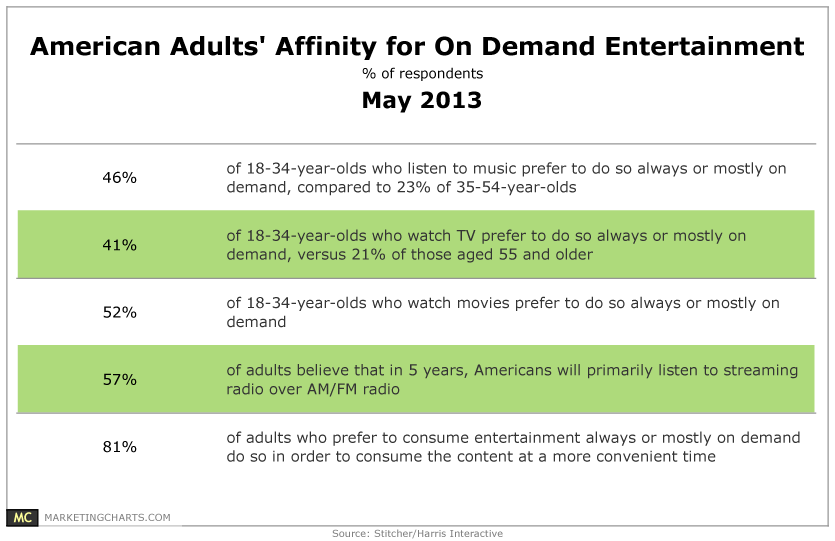
Americans aged 18-34 are more likely than their older counterparts to prefer a range of entertainment types on-demand.
Read MoreSenior Execs Attitudes Toward Social Media, May 2013 [TABLE]

51% of respondents feel that advertising in social media is more intrusive than advertising in a magazine or newspaper, while only one-third believe that a social media presence enhances a company’s reputation.
Read MoreConcentration Of Twitter Activity, May 2013 [CHART]
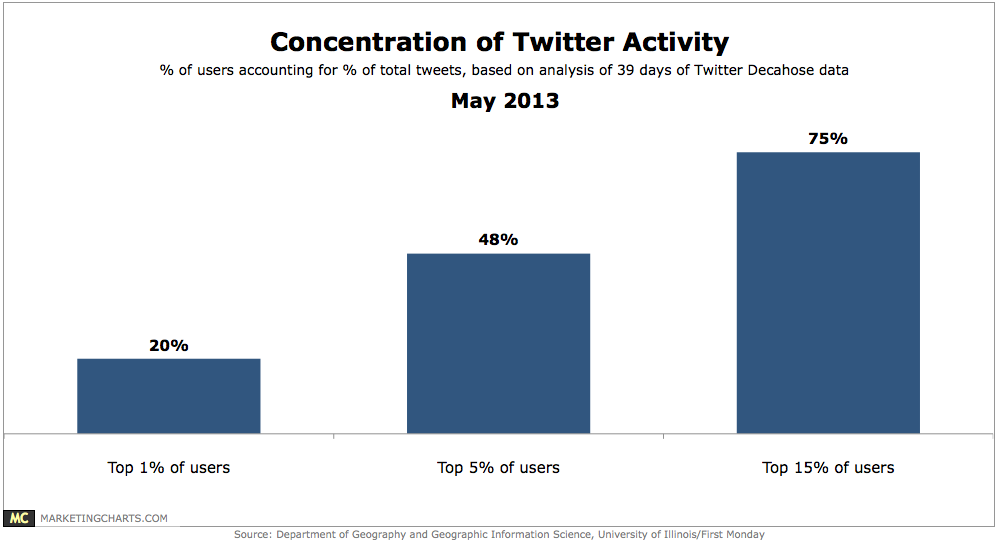
The top 1% of Twitter users accounted for 20% of all tweets.
Read MoreAffluents' Shopping Habits, May 2013 [TABLE]
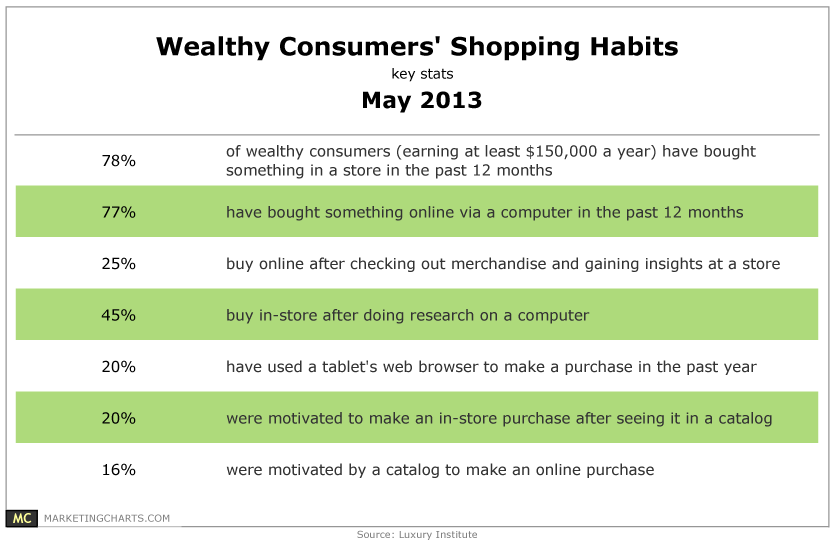
Wealthy consumers are as likely to make purchases in-store as online, and few have embraced showrooming, loosely defined as the practice of checking out a product in-store before buying online.
Read MoreSources That Inspire Online Purchases, May 2013 [CHART]
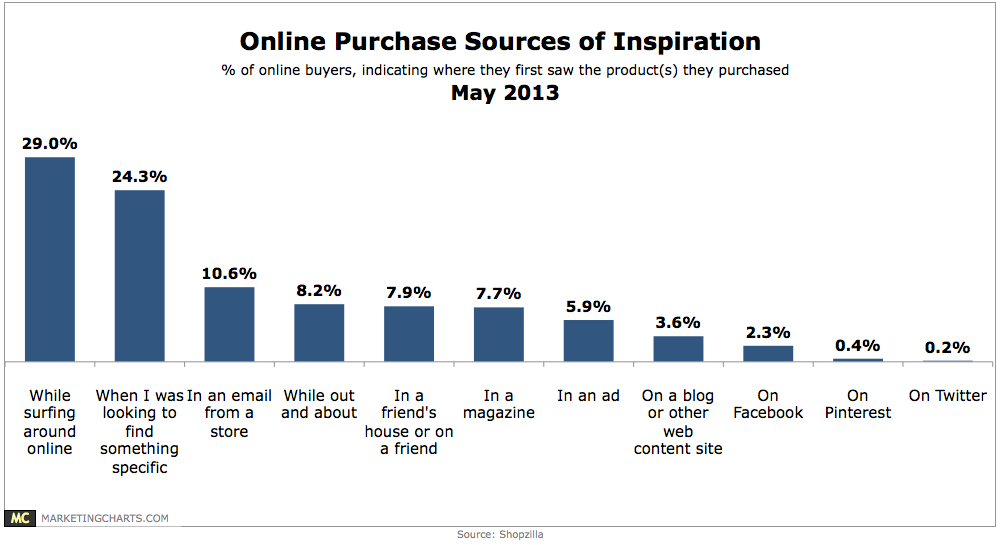
Buyers were most likely to have first seen their most recent online purchase while surfing around online (29%) or when looking to find something specific (25%).
Read MoreRetailers' Views Of The Future, May 2013 [CHART]
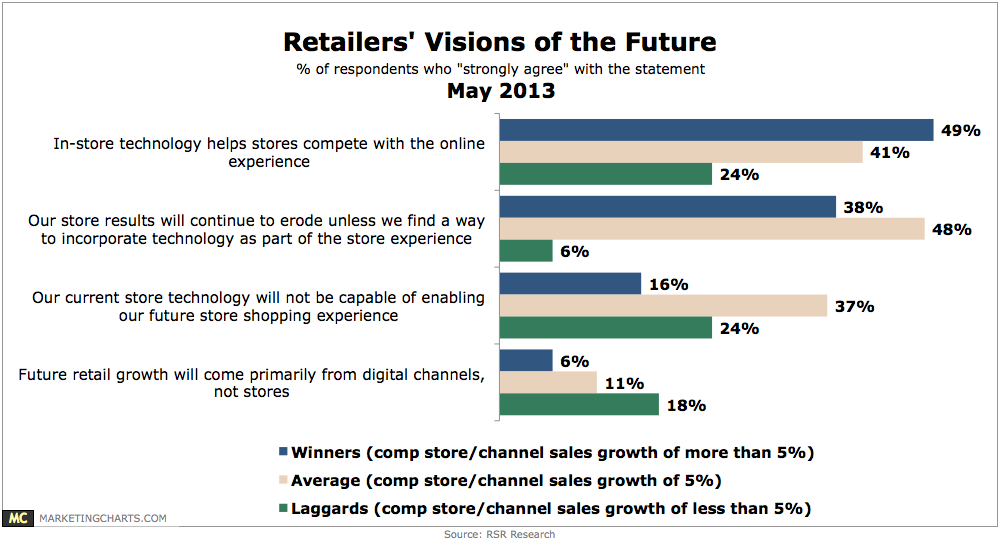
In general, retailers feel that future retail growth will come primarily from digital channels, not stores, with 40% agreeing with that sentiment, versus 29% disagreeing.
Read MoreConsumers Who Find Native Advertising Misleading, October 2012 [CHART]
In October 2012, a high percentage of US internet users found ads that appeared as content misleading.
Read MorePercent Of Viewing Time Spent Using Tablets By Generation, May 2013 [CHART]
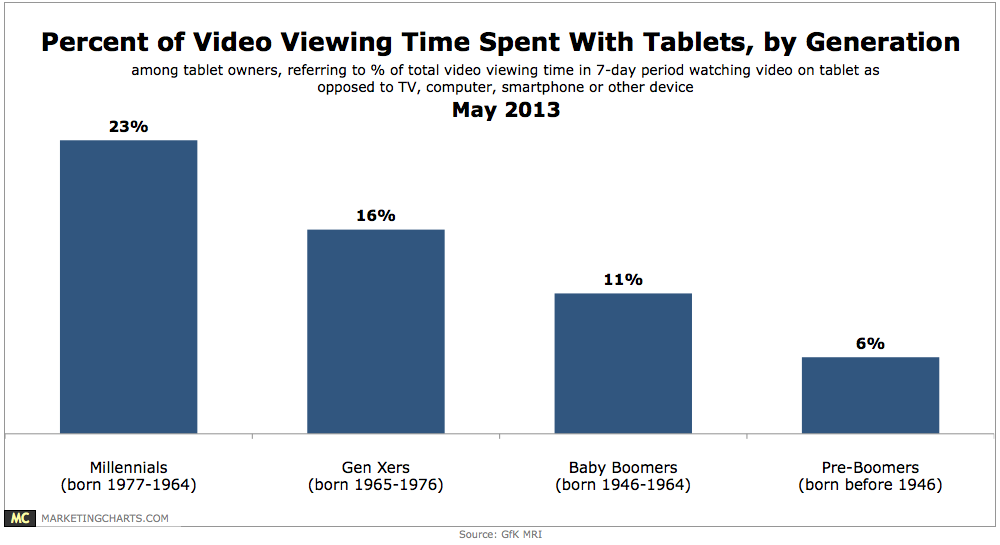
Among tablet owners, Millennials (born 1977-1994) spend on average 23% of their total video viewing time (time spent watching video on any device, including TV, in a 7-day period) with their devices.
Read More