Consumer Behavior
Global Online Sharing Tendencies By Country, May 2013 [CHART]
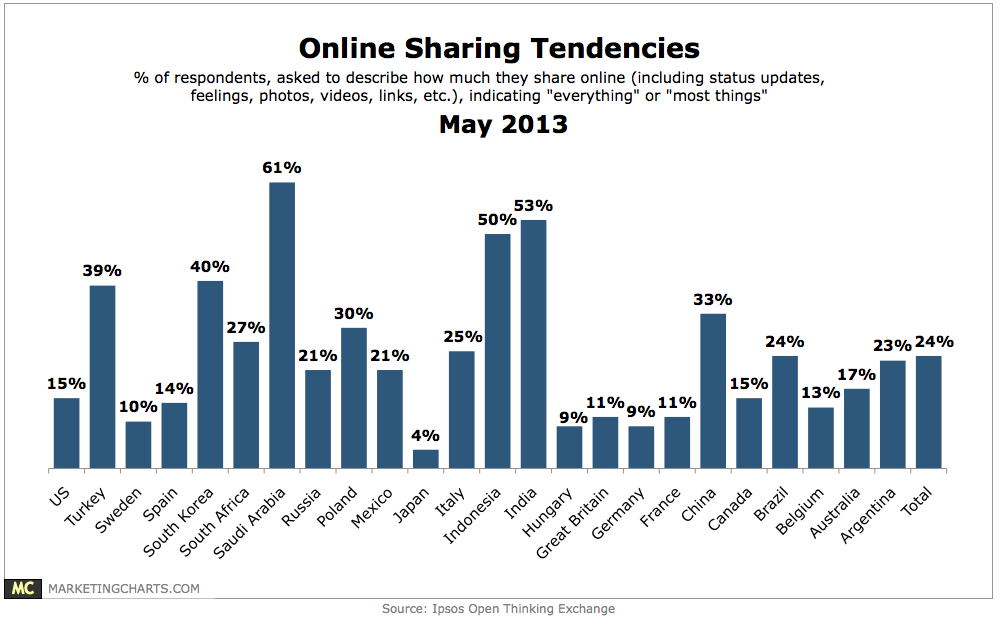
Across the 24 countries tracked, an average of 24% said they’d best describe their amount of sharing as either most things or everything.
Read MoreConsumer Spending Patterns, May 2013 [TABLE]
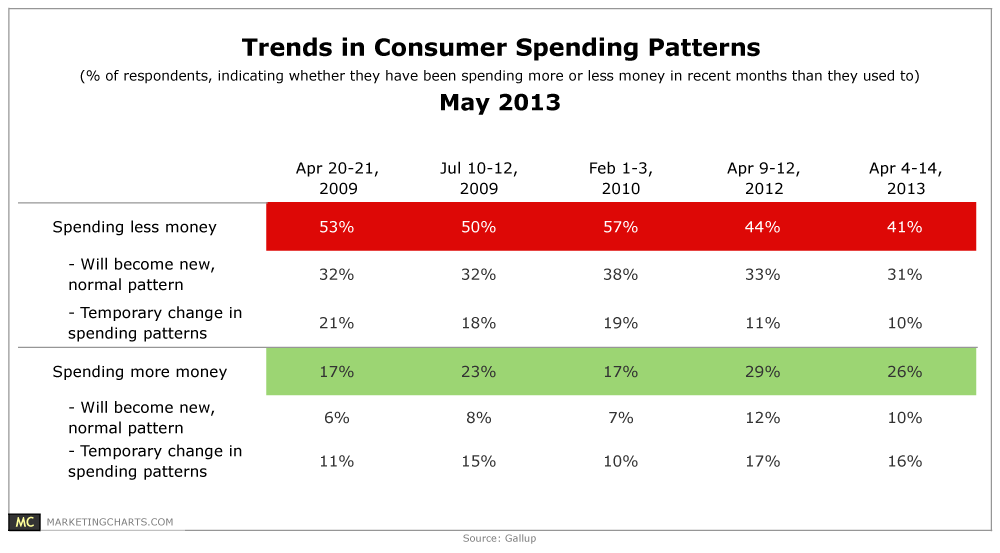
Overall, 73% of Americans polled in early April said they have been spending either less (41%) or the same (32%) amount of money in recent months than they used to.
Read MoreHigh School & College Graduation Spending, 2007-2013 [CHART]
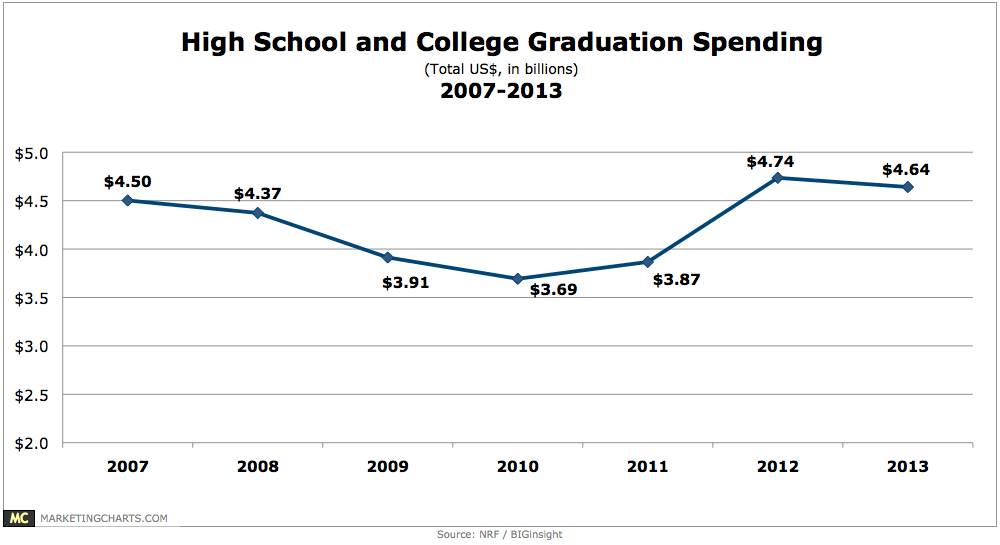
Graduation season is here, and Americans will shell out $4.6 billion to reward high school and college seniors.
Read MoreAmount Of Mobile Shopping By American Moms, December 2012 [CHART]

Only 11% of moms said mobile was the shopping method they would choose, if given only one option.
Read MoreProduct Categories That Interest Mobile Moms, March 2013 [CHART]
Clothing and beauty ranked as the top product categories for which moms shopped on their smart phones and tablets, at 56% and 47%, respectively.
Read MoreFrequency Of American Moms' Mobile Shopping, March 2013 [CHART]
35% of mobile moms said they used their device daily for shopping purposes.
Read MoreAmericans' Attitudes Toward Radio, May 2013 [TABLE]
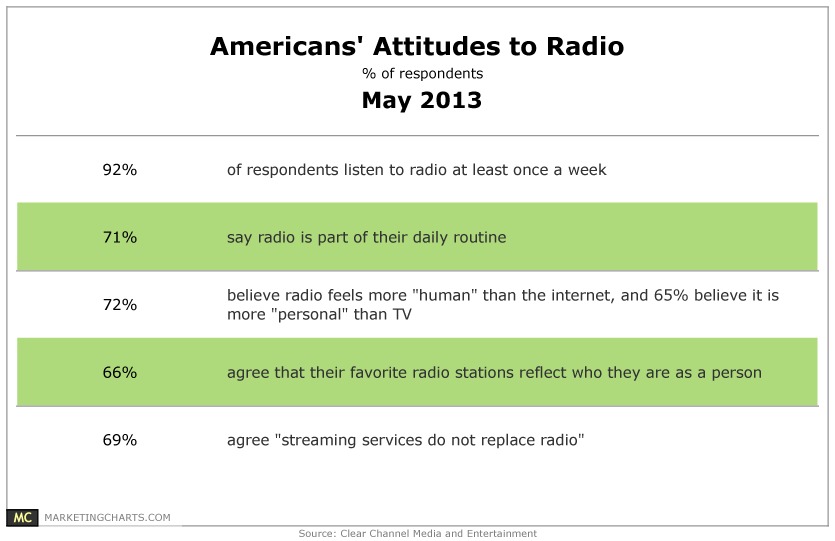
69% of respondents agree that streaming services do not replace radio.
Read MoreFrequency With Which SMB Employees Check Work Email After Hours, May 2013 [CHART]

Email is still very much an ingrained activity among SMB employees, to the extent that 74% check work email outside of standard work hours, with most of those doing so at least several times a day.
Read MoreShopping Apps People Download, April 2013 [CHART]
Just more than one-third of respondents said they had downloaded an app specific to a particular store.
Read MoremCommerce Customers, April 2013 [CHART]
55% of respondents had ever made a purchase on their mobile device, although only 9% did so with great frequency.
Read More