Consumer Behavior
US Vehicle Shoppers Who Have Visited An Auto Website On Smart Phone, 2010-2012 [CHART]
The percentage of in-market shoppers who visited an automotive website from their smart phone increased from 17% in 2010 to 31% in 2012.
Read MoreCreepy Loyalty Programs, December 2012 [CHART]
The creepiest were loyalty programs that see details of friends’ behavior, mentioned by more than half of respondents.
Read MoreMost Popular Types Of Loyalty Programs, December 2012 [CHART]
US internet users on average participated in 7.4 loyalty programs last year.
Read MoreAmerican Sports Content Consumption [INFOGRAPHIC]
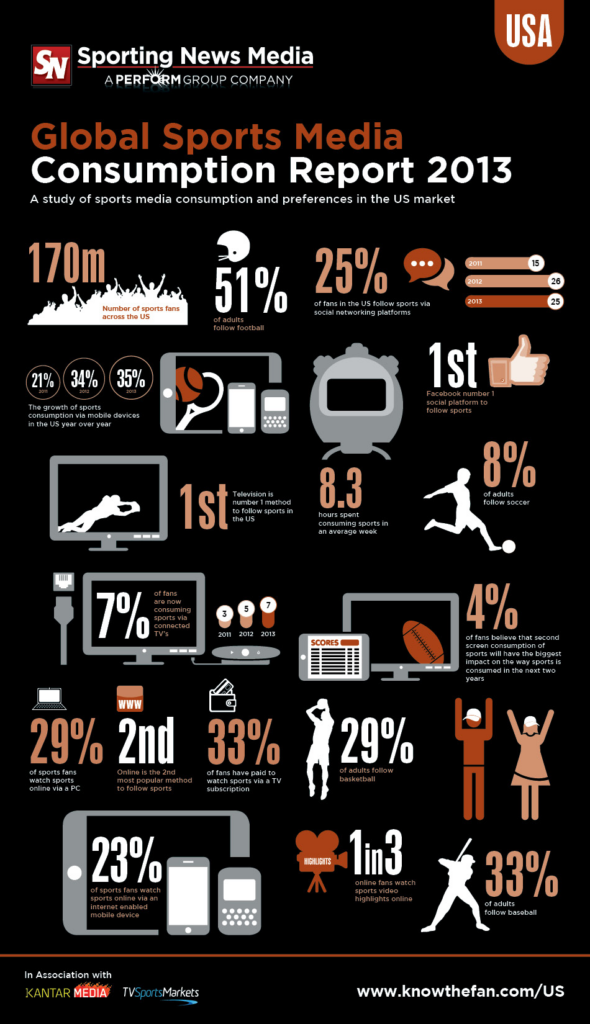
25% of sports fans use social media to follow leagues, teams and players online.
Read MoreAffluent Shoppers' Preferred Purchase Channels By Demographic, April 2013 [CHART]
The store still won out as the most common place to make a purchase among affluent consumers, cited by 78% of respondents.
Read MoremCommerce Activities Of Affluent Americans By Device, April 2013 [TABLE]
Among US internet users ages 21 and older earning more than $150,000, more than eight in 10 owned a smart phone, while 56% reported owning a tablet.
Read MoreWhere Americans Watch TV By Device, January 2013 [TABLE]
While smart mobile device users can now watch TV from anywhere, they still favor sitting at home to watch their shows.
Read MoreTime Americans Spend Watching Mobile TV By Device, January 2013 [CHART]
Only 2% of total TV viewership by American broadband subscribers who watched at least five hours of TV per week occurred on a tablet or smart phone.
Read MoreMothers’ Mobile Use By Weekday, June 2013 [CHART]
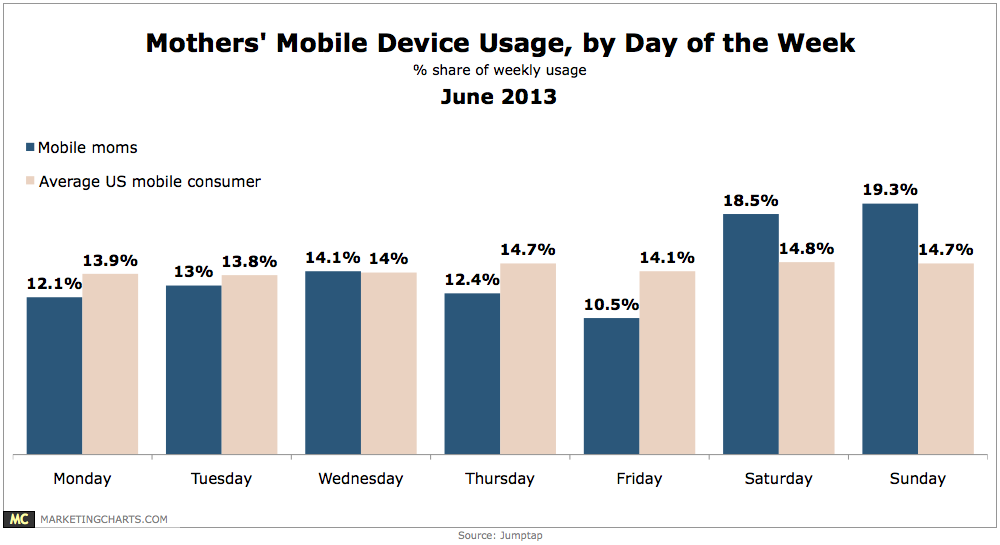
Almost 40% of mothers’ weekly time spent with their mobiles is on Saturday (18.5%) and Sunday (19.3%).
Read MoreB2B Procurers' Online Shopping By Age, June 2013 [CHART]
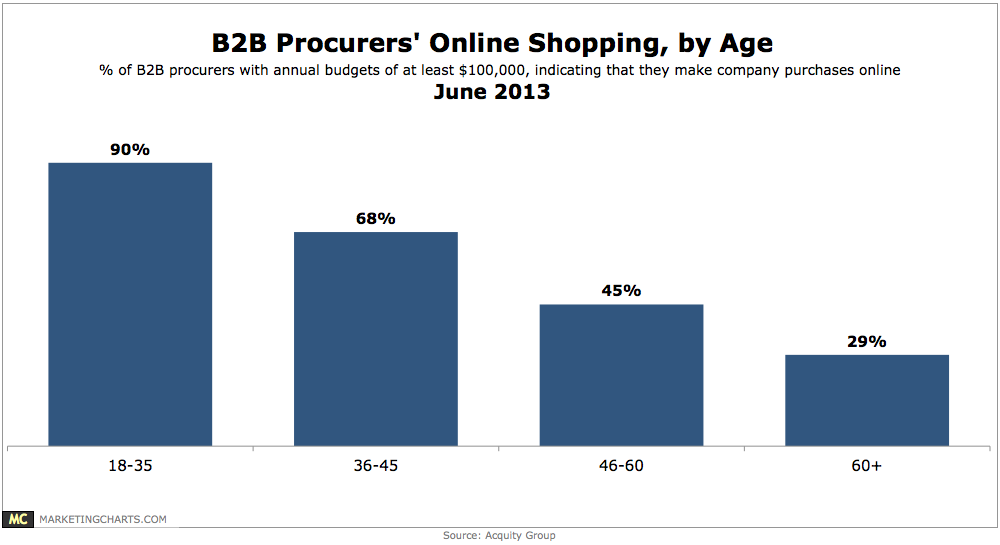
Millennial B2B buyers are far more likely than their older counterparts to make online purchases.
Read More