Consumer Behavior
Demographics Of Auto Website Visitors, June 2012 [CHART]
The 18-to-34-year-old segment still makes up a large portion of digital automotive media consumption.
Read MoreAmerican New-Vehicle Registrations By Generation, 2001-2012 [CHART]
In 2001, 18- to 34-year-olds registered 24% of all new vehicles in the US; by 2012, that figure had dropped to 13%.
Read MoreShare Of New Vehicles Purchased By American Millennials, 2001-2012 [CHART]
The Great Recession decimated auto sales volume in the US across the board, and may have swept a significant fraction of the youngest consumers from the automotive market permanently, as many learned to make do without a vehicle.
Read MoreVine Growth, December 2012 – May 2013 [CHART]
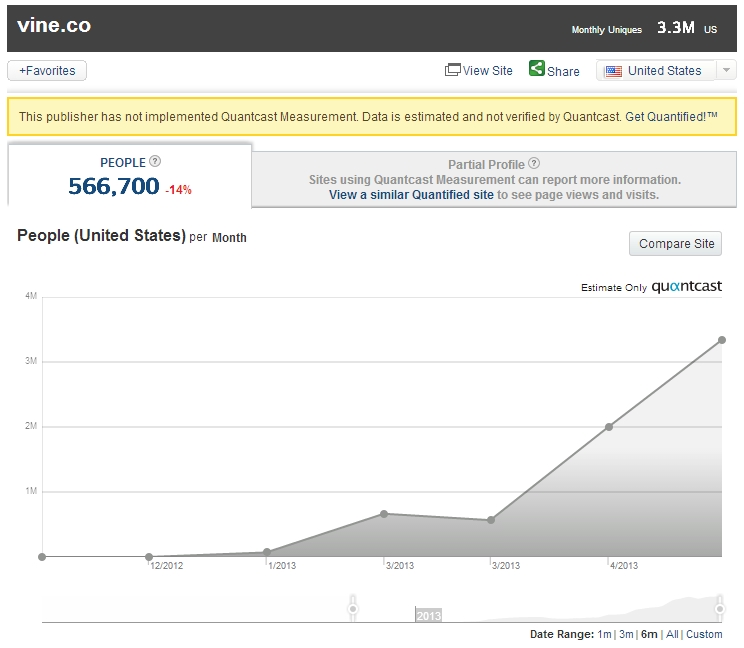
From just 77,000 unique visitors in January, Vine’s website vine.co grew to 3.6 million unique desktop visitors in May.
Read MoreLGBT Mobile Shopping Activities, June 2013 [CHART]
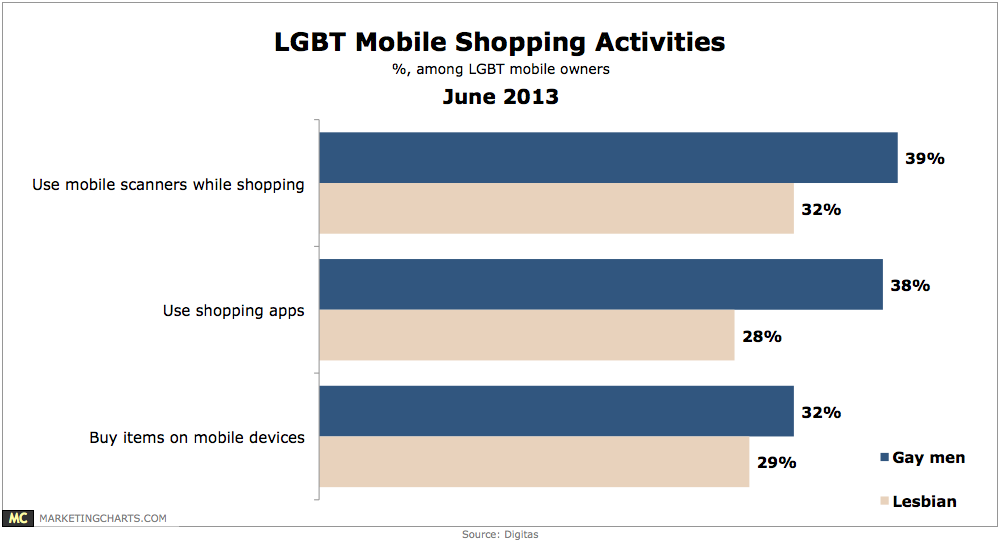
Men are more likely than women to engage in a variety of mobile shopping activities, with gay men more likely to: use mobile scanners while shopping (39% vs. 32%).
Read MoreConsumer Preference For Retail Self-Check Out, June 2013 [CHART]
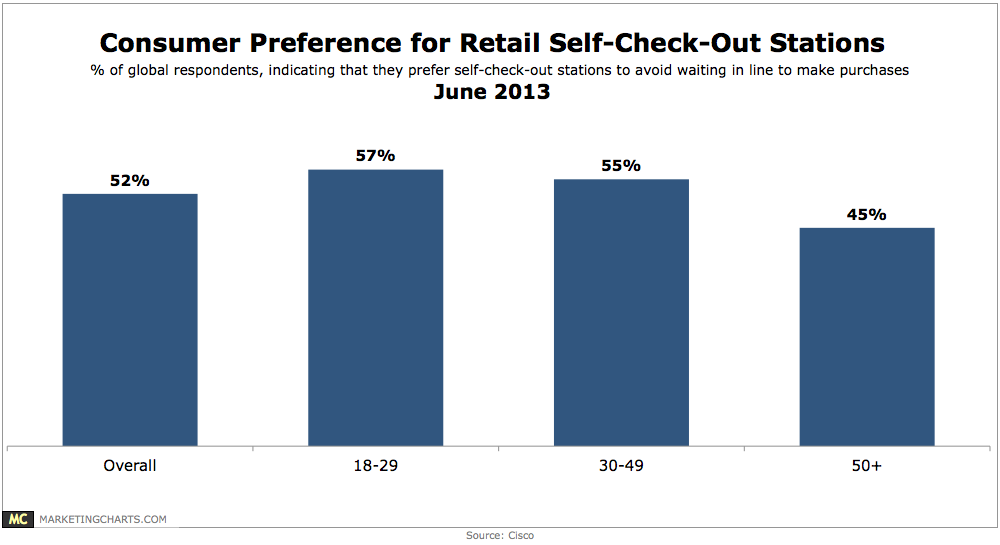
3 in 5 consumers around the world would be interested in shopping at a fully automated “self service” store with vending machines and kiosk stations offering a virtual customer service.
Read MoreConversion Rates Of Duplicate Leads, June 2013 [CHART]
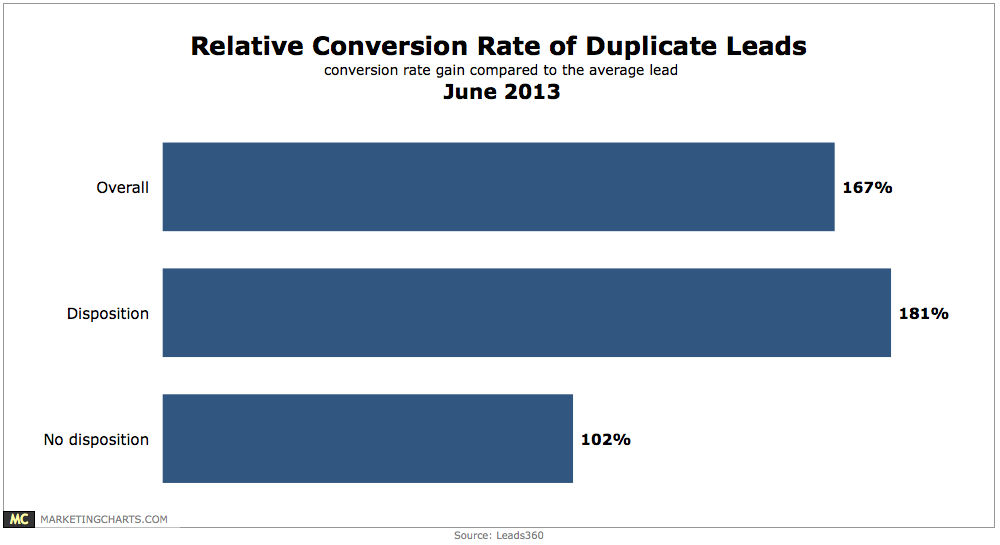
Leads360 found that those leads flagged as duplicates converted at a rate 167% higher than the average.
Read MoreSmart Phone Ownership By Income & Age, June 2013 [CHART]
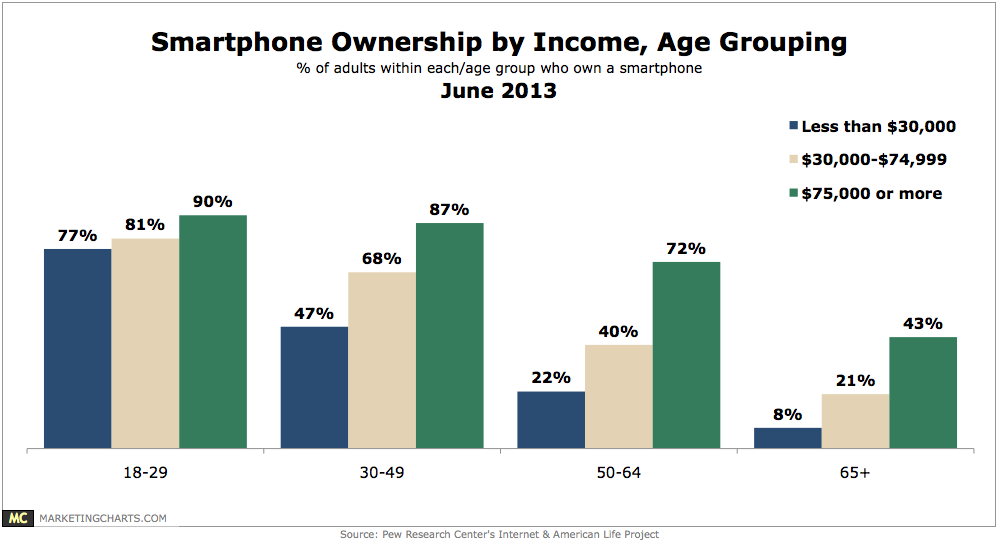
61% of American cell phone owners can be classified as smart phone owners.
Read MoreGlobal Mobile Payment Transactions By Device, June 2012 vs April 2013 [CHART]
Europe sports the world’s largest percentage of transactions made using a mobile device, at 15.3%, followed by Asia (12.4%) and North America (11.2%).
Read MoreShowroomers' Response To Permanent Price Matching, June 2013 [CHART]
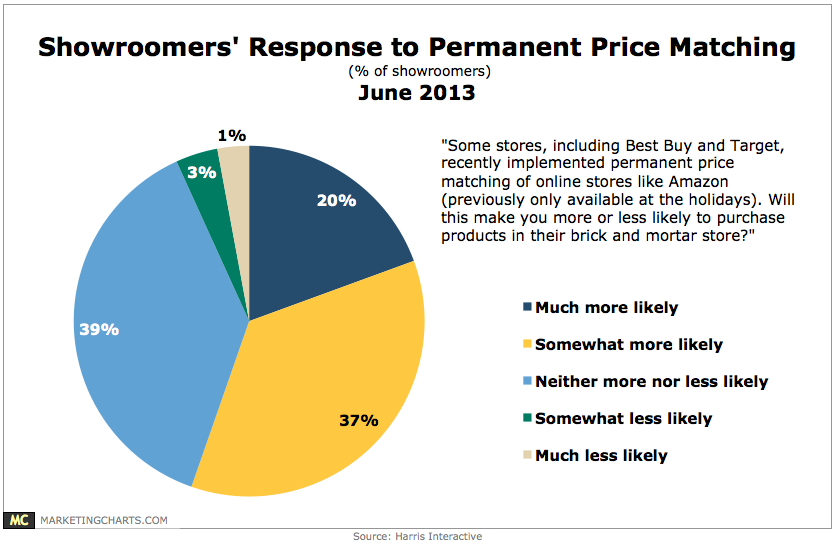
40% of American adults claim to have checked out a product in a brick-and-mortar store before purchasing it elsewhere online.
Read More