Consumer Behavior
Consumer Attitude Toward Ads On TV vs Original Streaming Video, January 2013 [CHART]
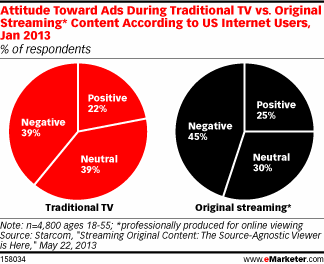
45% of consumers have a negative attitude to digital video ads vs. 39% who had negative opinions of ads shown on TV.
Read MoreDigital Video vs. TV For Awareness & Engagement, April 2013 [CHART]

Almost three-quarters of marketing professionals worldwide planned to increase their spending on branded video content or video ads in the next year.
Read MoreExpectation & Tolerance For Mobile Video Ads, June 2013 [CHART]
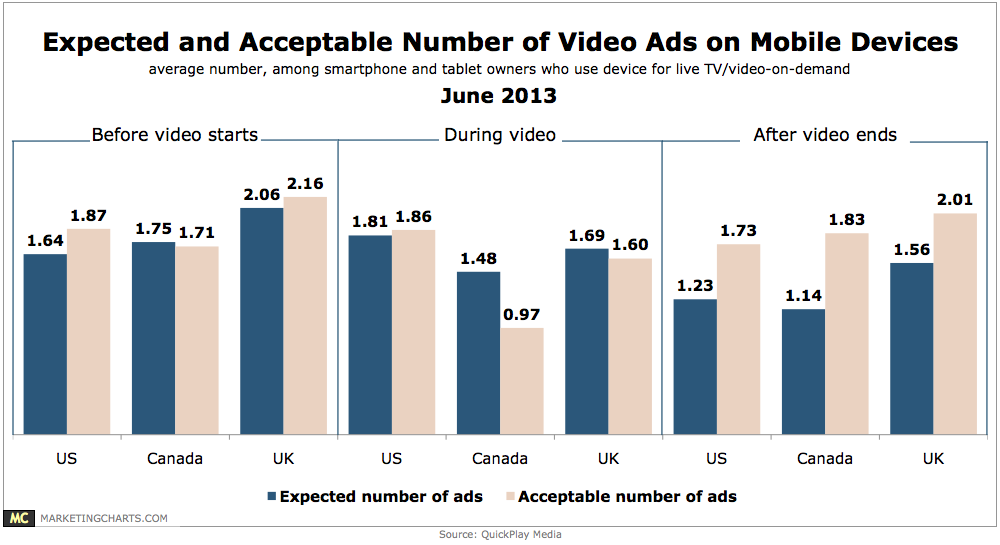
Research from comScore has shown that the average TV show is about one-quarter ads, while new figures from comScore indicate that online video ads accounted for just 2.6% of all minutes spent watching online video last month.
Read MoreCollege Student Spending, 2009-2013 [CHART]
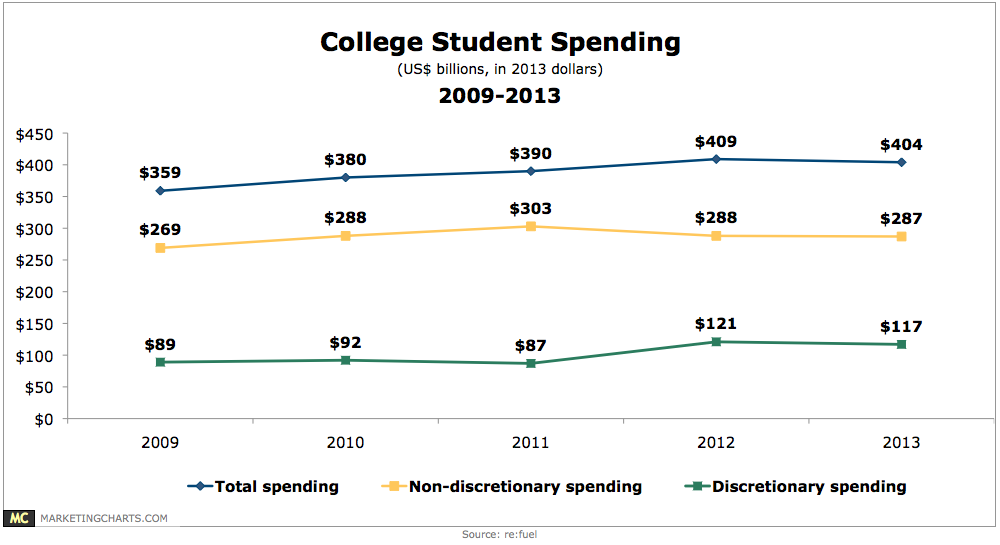
After a big jump last year, discretionary spending by college students is expected to remain largely flat this year at $117 billion, per the latest College Explorer report from re:fuel.
Read MoreConsumer Attitudes Toward Personalization, June 2013 [CHART]
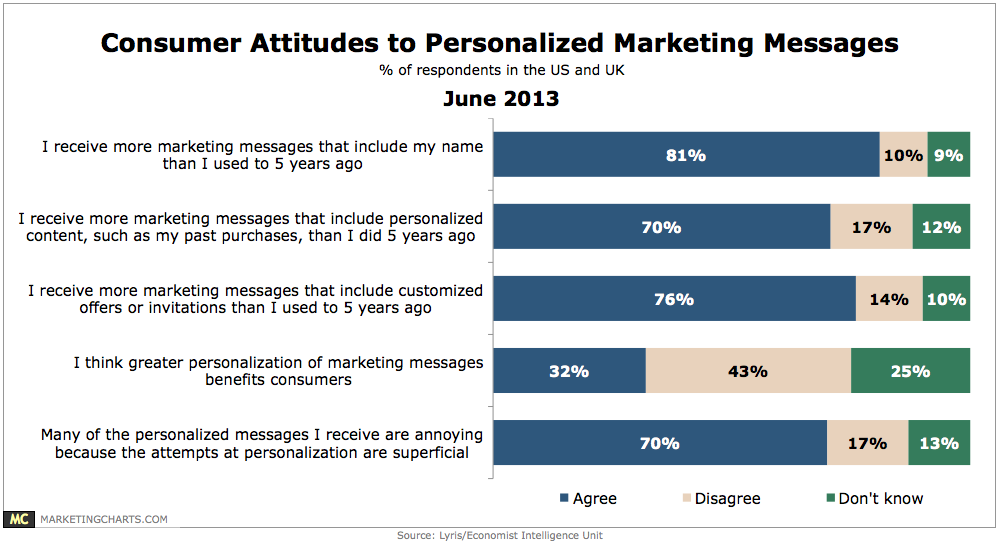
Only 32% of consumers in the US and UK agreed that greater personalization of marketing messages benefits consumers, while 43% disagreed.
Read MoreImmediate Text Message Marketing Responses By Industry, June 2013 [CHART]
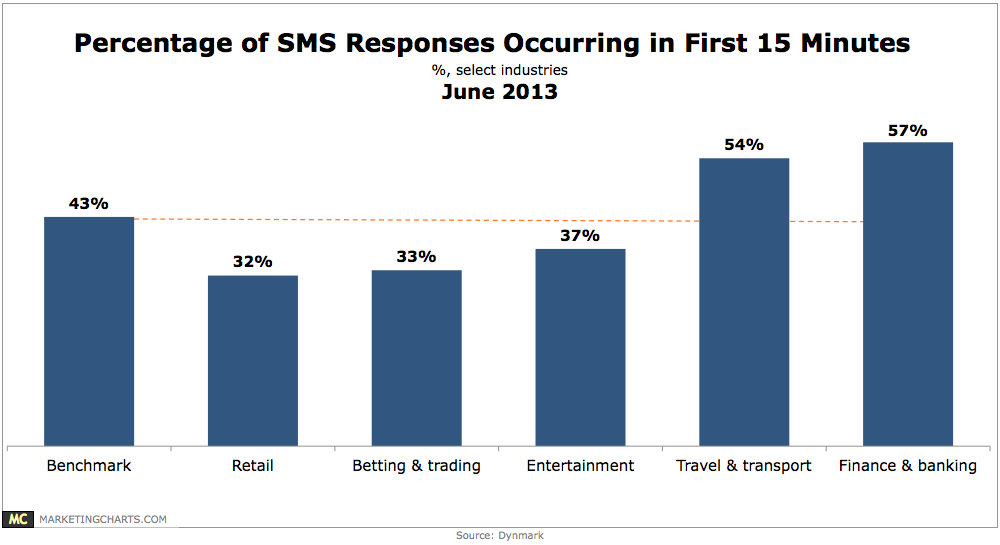
The finance and banking and travel and transport sectors garner quick responses, with 57% and 54% of their responses, respectively, coming in the first 15 minutes.
Read MoreReactions To A Friend's Product Like On Social Media, June 2013 [TABLE]
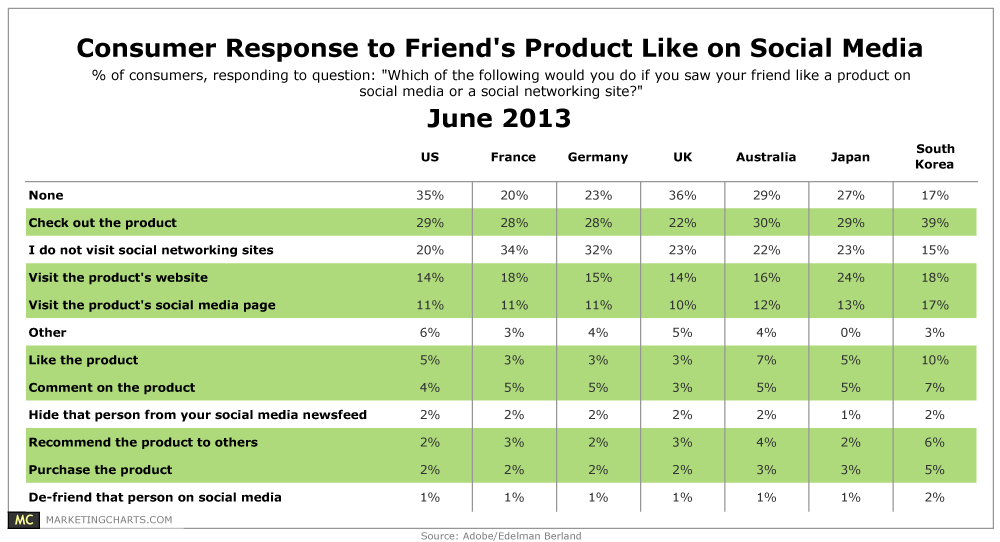
Asked what they would do if they saw a friend like a product on social media or a social networking site, around 3 in 10 consumers from around the world said they would check out the product themselves.
Read MoreFactors That Influenced TV & VOD Consumption On Alternate Devices, June 2013 [CHART]
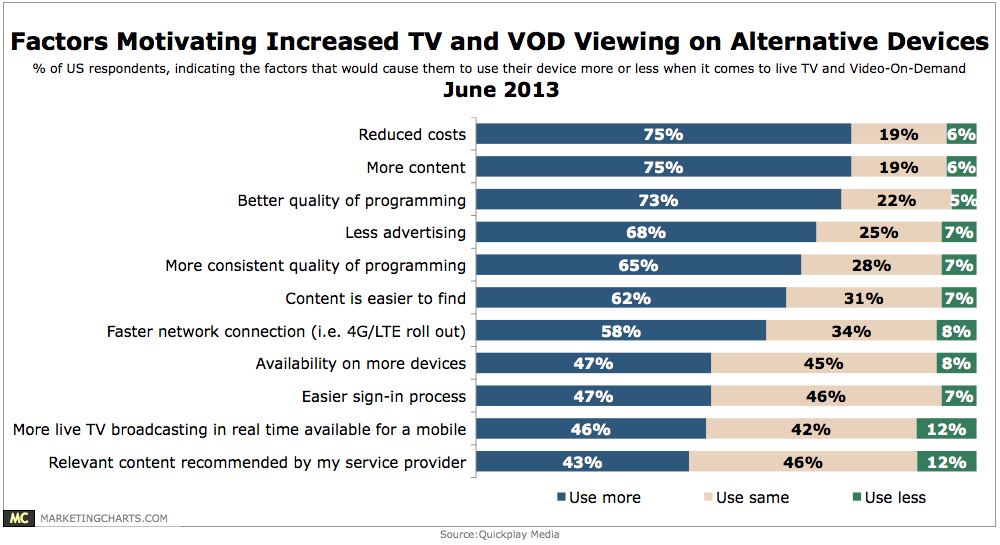
Roughly three-quarters of respondents in the US would be motivated to use their devices more for live TV and VOD viewing on account of reduced cost, more content, and better quality of programming.
Read MoreDemographic Profile Of American Tablet Owners, November 2010-May 2013 [TABLE]
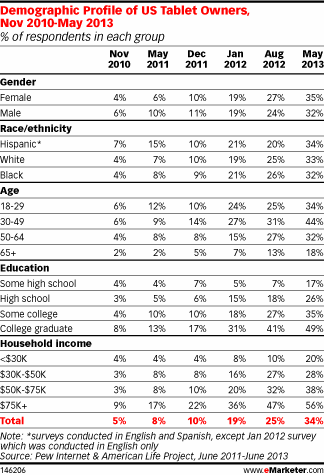
Tablet ownership among Hispanics made a big leap, with penetration rates rising from 20% in August 2012 to 34% by May 2013.
Read MoreConsumer Attitudes Toward Online Personal Data Collection, June 2013 [CHART]
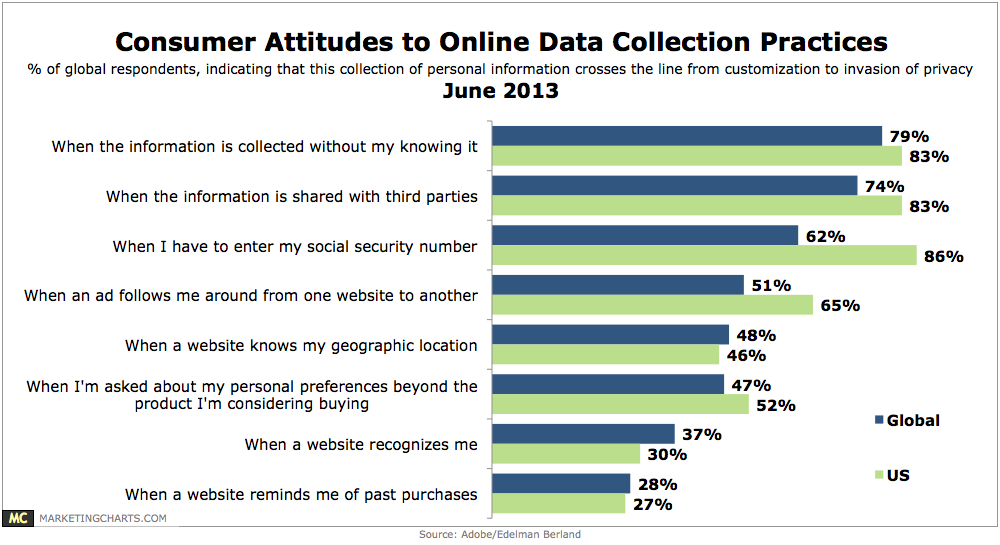
Consumers around the world find website customization to be of some value, with 33% of respondents attributing some value to personalized product and service recommendations on websites, compared to 26% seeing little to no value.
Read More