Consumer Behavior
Broadband Subscribers' TV & Movie Sources, August 2013 [CHART]
2 in 3 young US and Canadian subscribers to fixed broadband services (cable, DSL, FTTH) are accessing at least some video programming through over-the-top (OTT) services such as Netflix and Hulu as well as a variety of mobile applications.
Read MoreB2C Marketers' Customer Insights, August 2013 [CHART]
Almost 9 in 10 B2C marketers believe they could do a better job at customer engagement with access to more comprehensive data sources; only a minority have a clear understanding of their customers.
Read MoreMobile Media & Entertainment Brands Ranked By User Satisfaction, August 2013 [CHART]
User satisfaction with mobile media entertainment sites and apps outpaces satisfaction among those accessing the services via PC.
Read MoreReach Of Facebook vs. TV By Age, August 2013 [CHART]
During the weekday daytime hours, Facebook’s PC-only reach is greater than either of the networks among all age groups except for the 55-64 and 65+ brackets.
Read MoreAmericans' Daily Media Consumption, 2010-2013 [CHART]
This year, for the first time, consumption of non-voice activities on mobile devices will exceed time spent online on desktop and laptop computers.
Read MoreSMBs' Use Of Social & Mobile Tools, August 2013 [TABLE]
72% of SMBs are using social media to promote their businesses, with 66% reporting “extremely” or “very” high levels of engagement with their customers.
Read MoreShare Of Millennials Living At Home, 2007-2012 [CHART]
The proportion of Millennials living in their parents’ home is on a steady upswing.
Read MoreFrequency Of Local Television News Consumption On TV vs. News App, 2013 [TABLE]
Among those who had a local TV news app, 36% said they watched local news on TV seven or more times during the seven days prior to the survey.
Read MoreAmerican Smart Phone Owners' Primary Sources For Local News, 2013 [CHART]
More than one in four surveyed adult US smart phone owners said they had a news app from a local TV station installed on their phone in 2013.
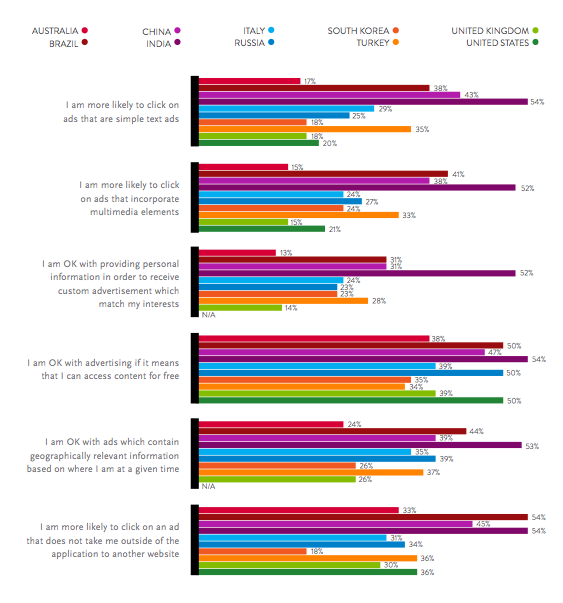
Read MoreMost & Least Preferred Personalization Tactics, March 2013 [CHART]
Recommendations for products that marketers think the consumer might like came out on top, cited by 48% as the feature they would most like to see in a targeted ad.
Read More