Consumer Behavior
Feature Phone Users By Age, August 2013 [CHART]
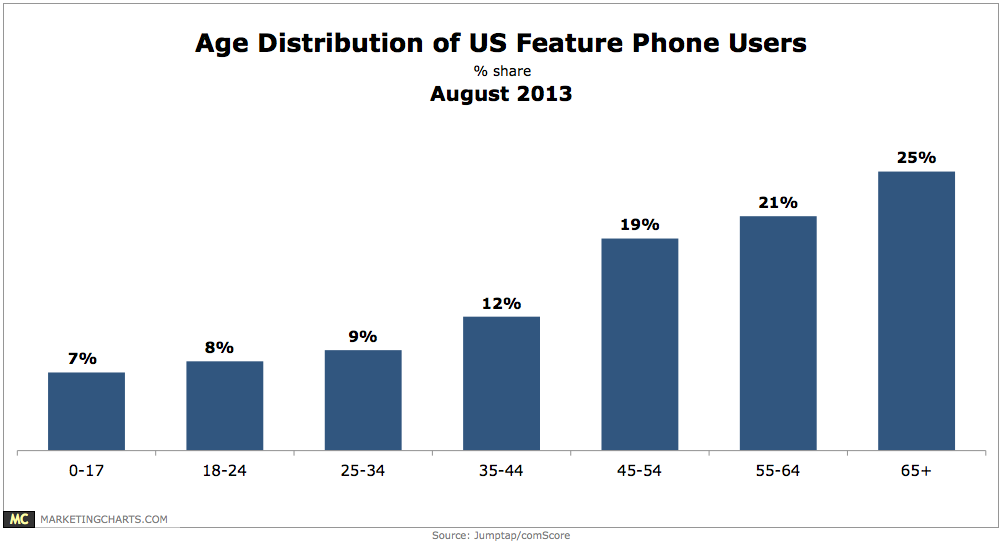
40% of the mobile market hasn’t yet made the switch to smart phones.
Read MoreiPhone & iPad Use By Hour Of The Day, May 2013 [CHART]
When it comes to mobile device use, the prevailing wisdom is that tablets are mostly used at home, while smartphones are more often used on-the-go.
Read MoreBrand- & Product-Related Content Sharing By Demographics, August 2013 [CHART]
11% of online Americans have forwarded a link to a brand or product’s video to someone.
Read MorePay-TV & Broadband Subscription Trends, Q2 2013 [CHART]
The top multichannel video providers, who represent around 94% of the market, shed a total of 344,318 subscribers during the second quarter.
Read MoreEmail Click Frequency By Gender, August 2013 [CHART]
Consumers open emails throughout the day, but only click through those emails at specific preferred times, and those windows are often short.
Read MoreeTailing: Comfort With Mobile Purchases By Price Range & Device, August 2013 [CHART]
29% of tablet owners are willing to spend at least $500 on retail purchases from their device, almost double the percentage (16%) of smartphone owners willing to spend that much.
Read MoreEmail Click-to-Open Rates By Industry, Q2 2012 [CHART]
49% of email opens happen on a mobile device.
Read MoreCross-Device Shopping Research & Purchase Behavior, August 2013 [CHART]
Consumers are using various devices to conduct retail shopping research, and are often crossing from one device to another to make purchases.
Read MoreReach & Frequency Of Online Video Ads, January – July 2013 [CHART]
Online video ad reach took a step forward in July, increasing to 55.4% of the US population from 53.6% in June.
Read MoreOnline Video Ad Views, December 2011 – July 2013 [CHART]
Online video ad views have been increasing at a torrid pace through the first half of this year.
Read More