Consumer Behavior
Online Video Ad Viewability Averages By Source, Q1 2013 [CHART]
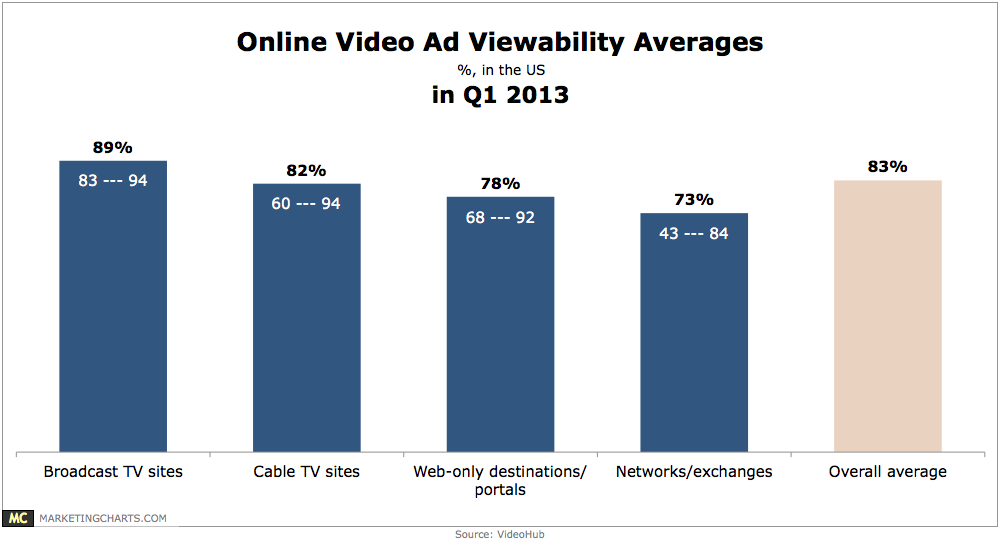
During the first quarter, average viewability for online video ads in the US was 83%, although rates varied widely among properties.
Read MoreSocial Media's Purchase Influence, US vs. Global Average, August 2013 [CHART]
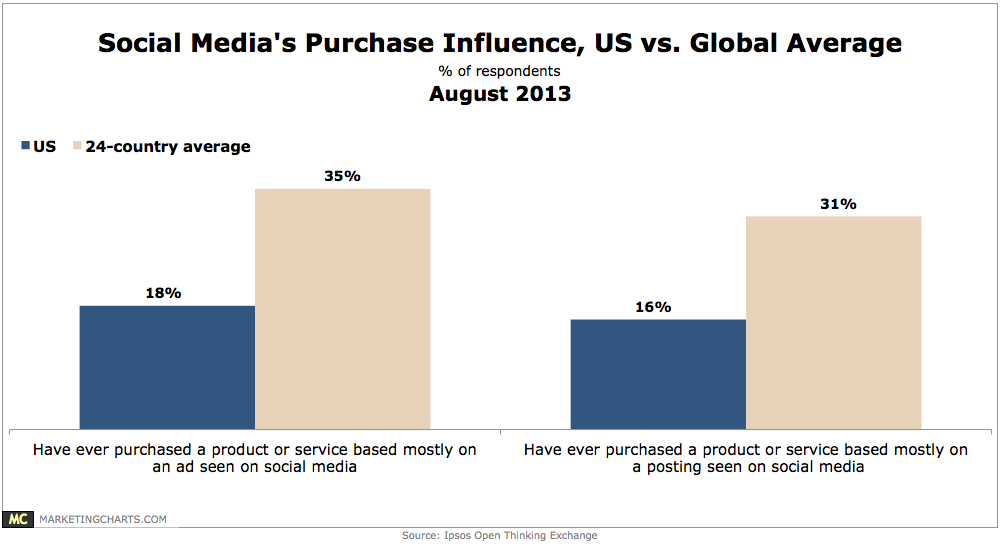
35% of online consumers across 24 countries claim to have ever purchased a product or service based mostly on an ad they saw on a social media site.
Read MoreHow Hospitality Businesses Use Mobile To Engage With Customers, January 2013 [CHART]
More than one-fifth of accommodation businesses worldwide used mobile devices to present customers with special offers.
Read MoreHotels' Mobile App Features, April 2013 [TABLE]
Making reservations was the most common feature on existing mobile apps employed by hotels, used by 72%.
Read MoreDigital Tech Used By Hotels, 2012 & 2013 [TABLE]
Hotels’ use of many digital technologies increased between 2012 and 2013.
Read MoreYelp Reviews & Small Businesses [INFOGRAPHIC]
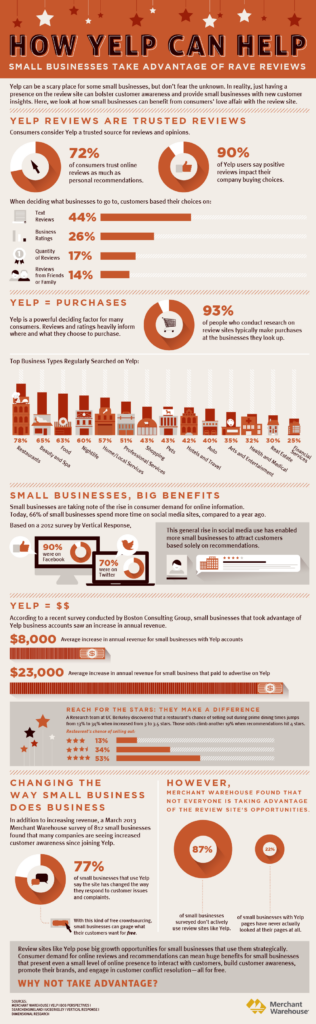
This infographic from Merchant Warehouse illustrates Yelp reviews affect on small businesses.
Read MoreCollege Students' Attitudes Toward Brands On Social Media, August 2013 [CHART]
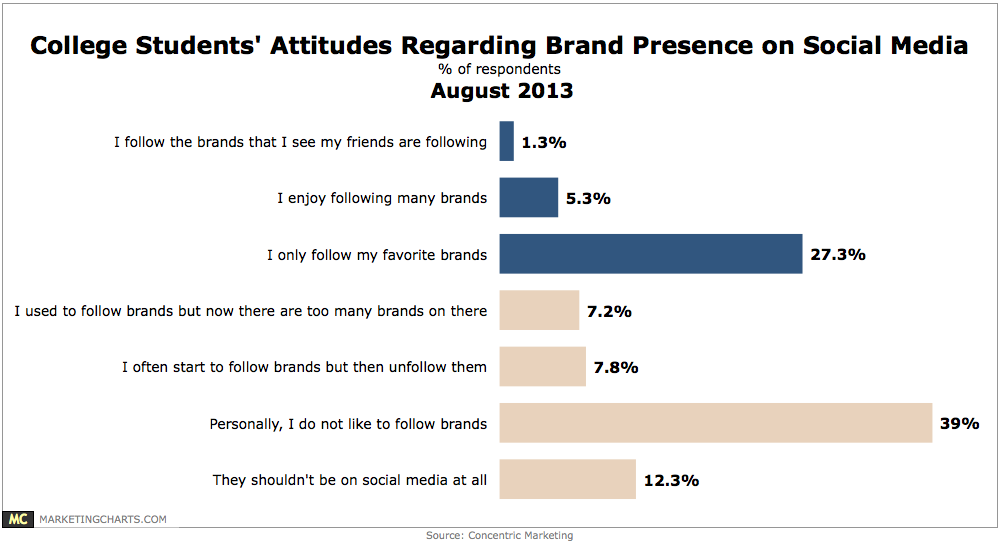
While nearly all college students have a Facebook account and three-quarters a Twitter account, roughly 4 in 10 don’t like to follow brands and about 1 in 8 don’t believe brands should be on social media at all.
Read MoreViewers' Attitudes Toward Streaming Video, August 2013 [CHART]
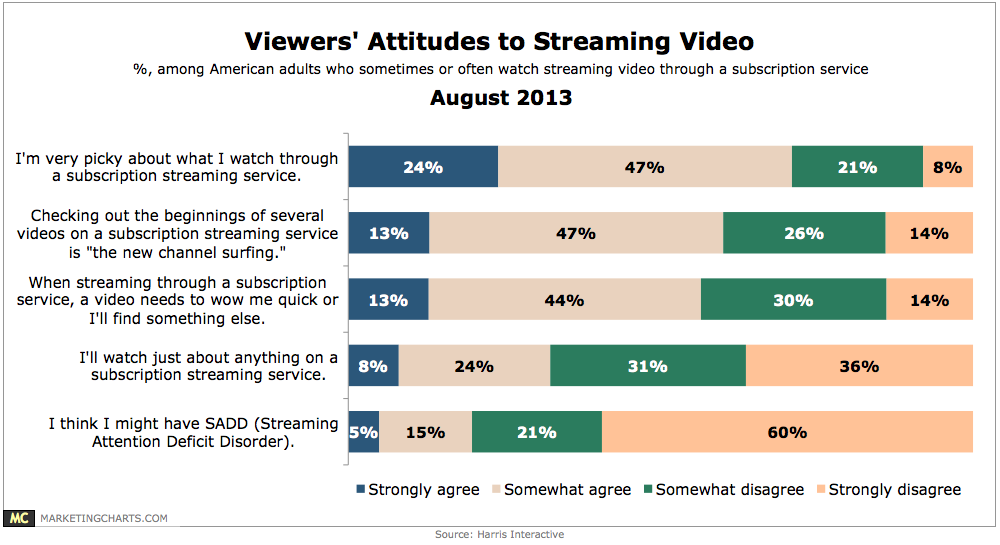
35% of American adults often or sometimes watch streaming video through a subscription service such as Netflix of Hulu Plus.
Read MoreConsumers' Definitions Of Online Recommendations, August 2013 [CHART]
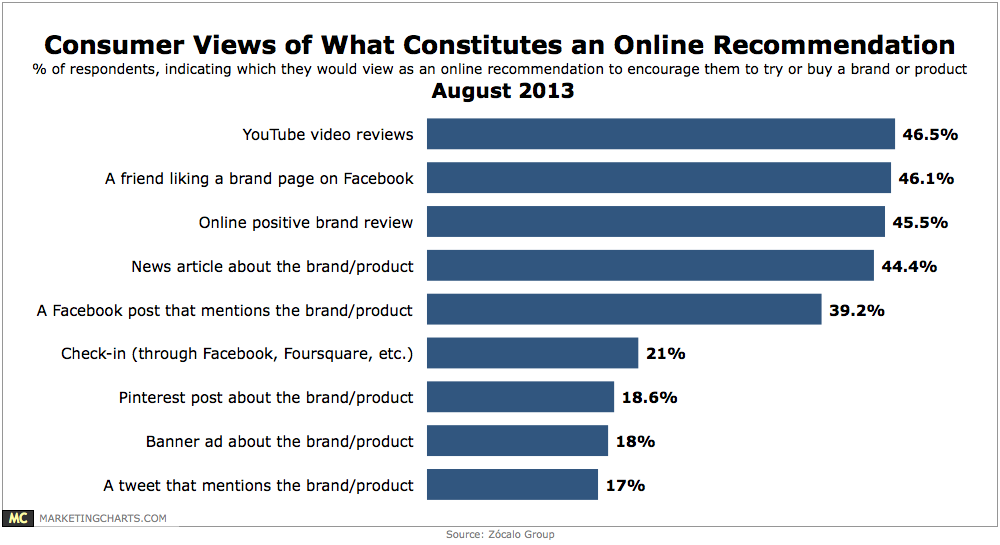
Whatever the reason for a friend’s like, many consumers consider it to be a recommendation.
Read MorePositive Attitudes Toward PR & Ad Industries By Age, August 2013 [CHART]
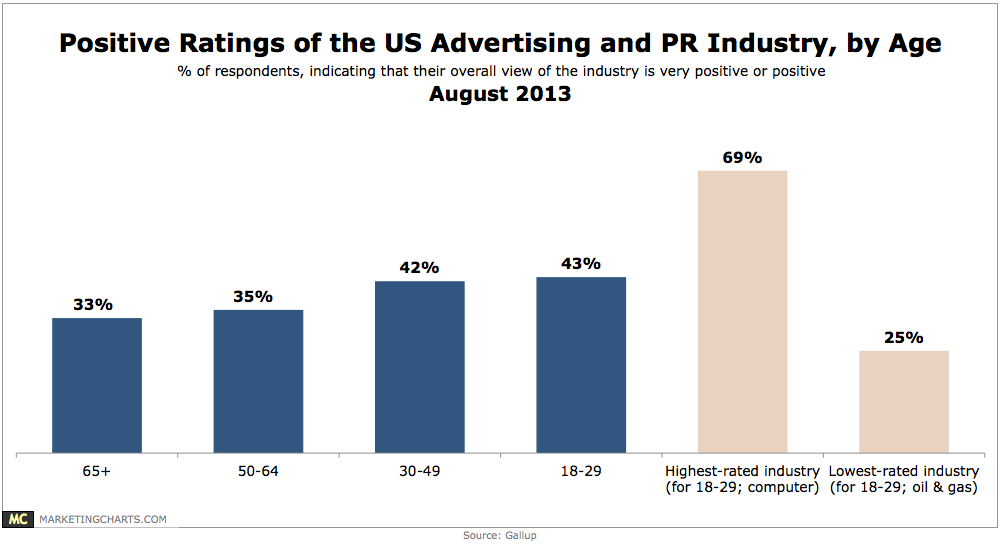
Some good news for the future of the advertising and PR industry: youth are more likely to perceive it a positive light than their older counterparts.
Read More