Consumer Behavior
Radio’s Weekly Reach, September 2009-September 2013 [CHART]
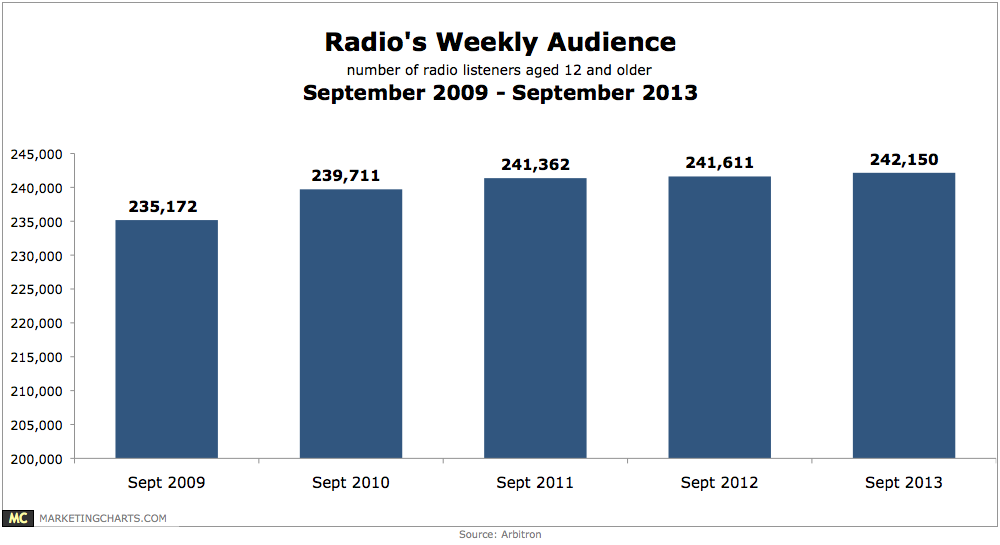
Radio now reaches 242.2 million listeners aged 12 and older on an average weekly basis, an increase of more than half-a-million listeners from the same period last year.
Read MoreVideo Ad Completion Rates By Length, Q1 2013 [CHART]
Completion rates were lowest for video ads that lasted between 30 to 60 seconds (77%), but ads that ran for 30 seconds or less saw an 84% completion rate.
Read MoreUS Online Video Traffic & Useage Metrics, 2012 & 2017 [TABLE]
In 2012 averaged 4.6 exabytes per month, and by 2017, that figure will more than triple to 17.1 exabytes per month.
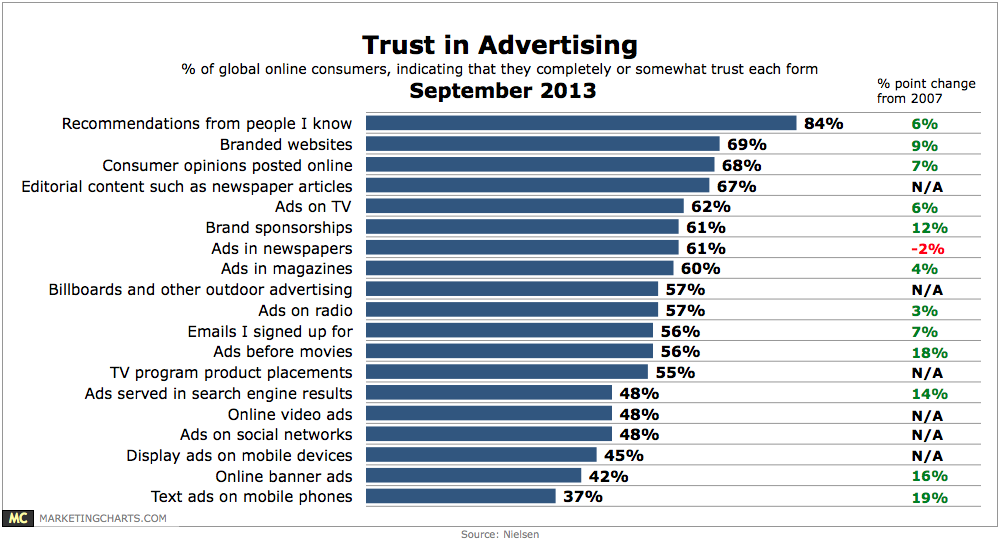
Read MoreLuxury Buyers' Research Habits, September 2013 [CHART]
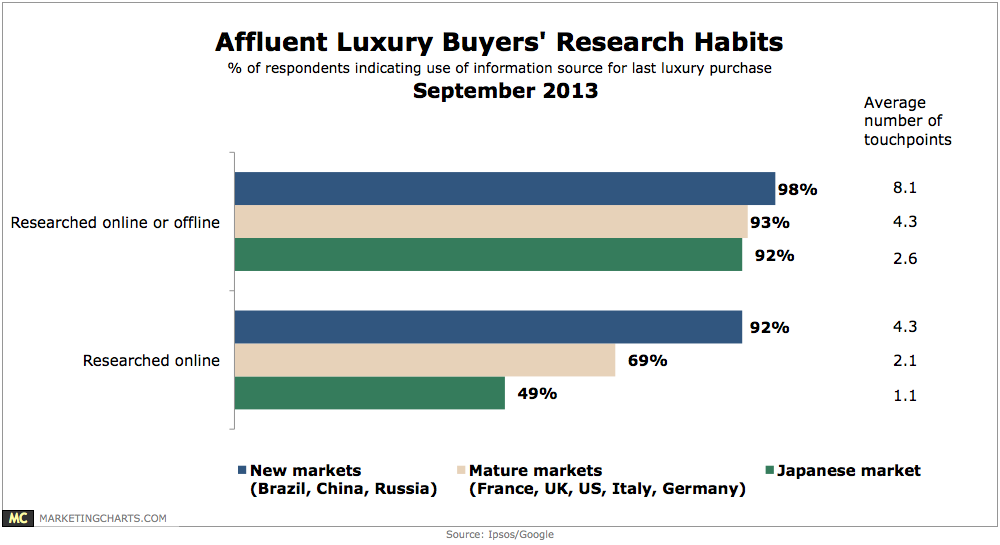
More than 9 in 10 luxury buyers search for information prior to making a purchase.
Read MoreShare Of eCommerce Site Visits By Source, Q2 2012 – Q2 2013 [CHART]
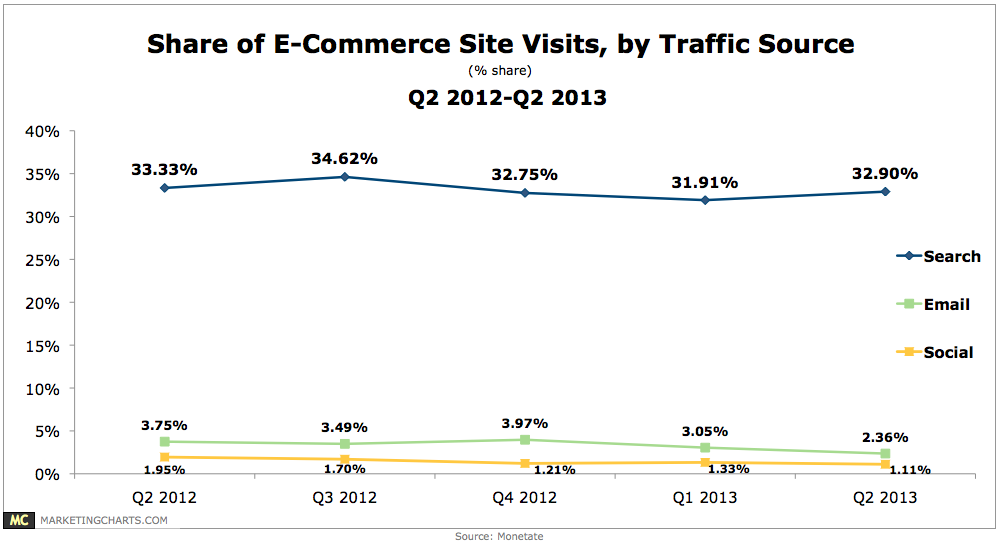
About one-third of the sampled e-commerce site visits in Q2 came from search, compared to roughly 2.4% from email and just 1.1% from social media.
Read MoreConsumer Interest in Wearable Technology, September 2013 [TABLE]
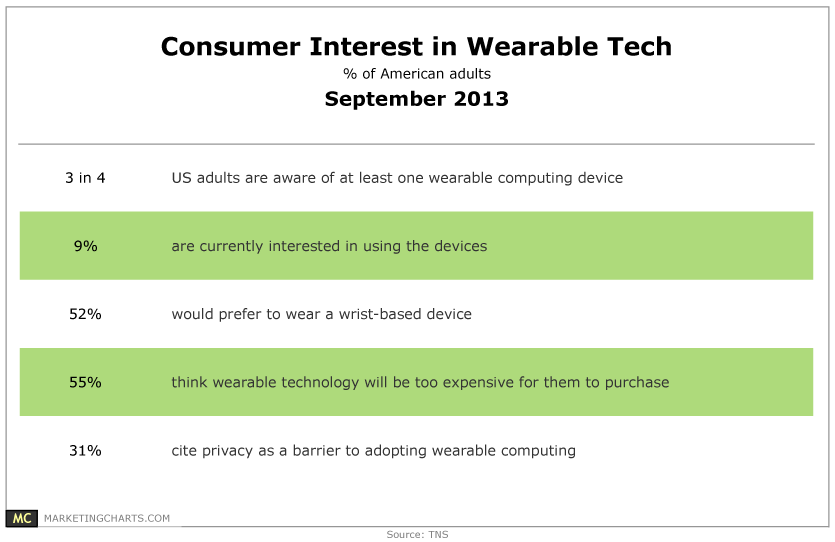
3 in 4 American adults are aware of at least one wearable computing device.
Read More
Attitudes Of Singles Toward Their Relationship With Their Smart Phone By Age, May 2013 [TABLE]
More than half of single smart phone users between 21 and 42 years old said they were so dependent on their mobile device that it was like an addiction.
Read MoreUS Households By Type, 1970-2012 [TABLE]
The number of men and women living alone or in nonfamily households increased 78.7% since 1970 to 33.6 million households in 2012, or more than one-third of total US households.
Read More