Consumer Behavior
Monthly Average Video Game Revenue Per User By Game Type, 2012 [CHART]
Although mobile games are a growing category, they also generate less average revenue per user than other forms of gaming.
Read MoreUS Video Game Revenues By Type, 2009-2012 [CHART]
In 2012, the “other” video game category grew to $7.7 billion, up from $5.4 billion in 2009.
Read MoreUS Mobile Gaming Revenues By Type, 2011-2017 [CHART]
eMarketer estimates the number of US mobile phone gamers will reach 125.9 million in 2013.
Read MoreLead Generation: How Appointments Are Set With Marketers, October 2013 [CHART]
The average connect rate for lead gen efforts aimed at marketing professionals was 13%, compared to 10-12% for other professions.
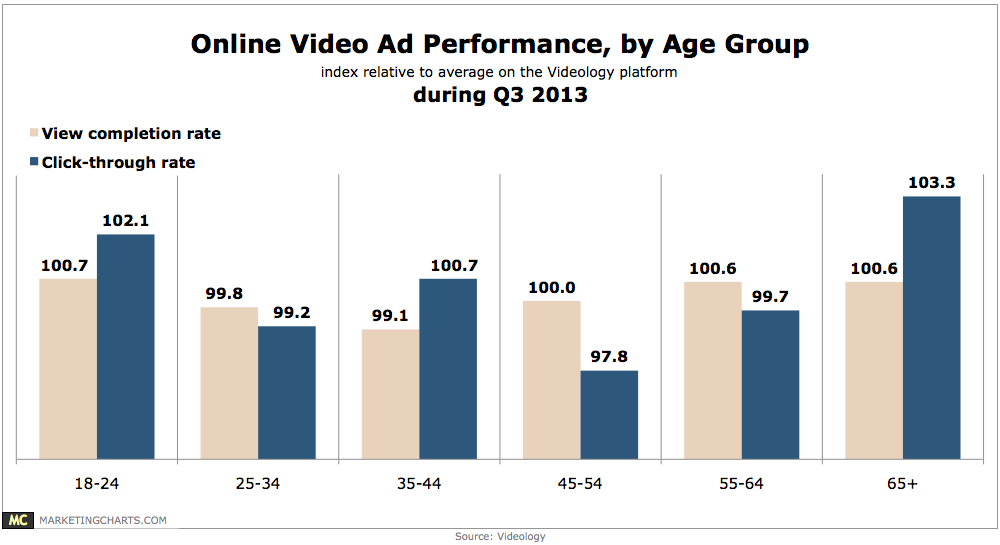
Read MoreOnline Video Ad Performance By Age, Q3 2013 [CHART]
Slightly fewer than 1 in 8 online video ads in the US were targeted towards the 65+ crowd during Q3.
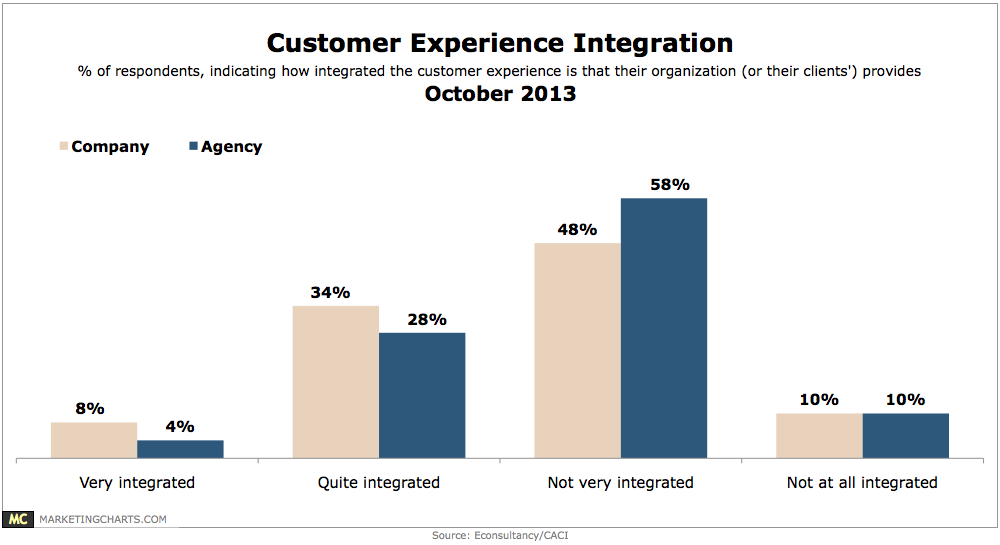
Read MoreCustomer Experience Integration, October 2013 [CHART]
Just 8% of company respondents lay claim to a “very integrated” customer experience – and only 4% of agencies can say the same about their clients.
Read MoreFastest-Growing Mobile Apps, Q1-Q3 2013 [CHART]
Vine is the year’s fastest-growing mobile application to-date, with its global audience increasing by an estimated 403% from Q1 through Q3 2013.
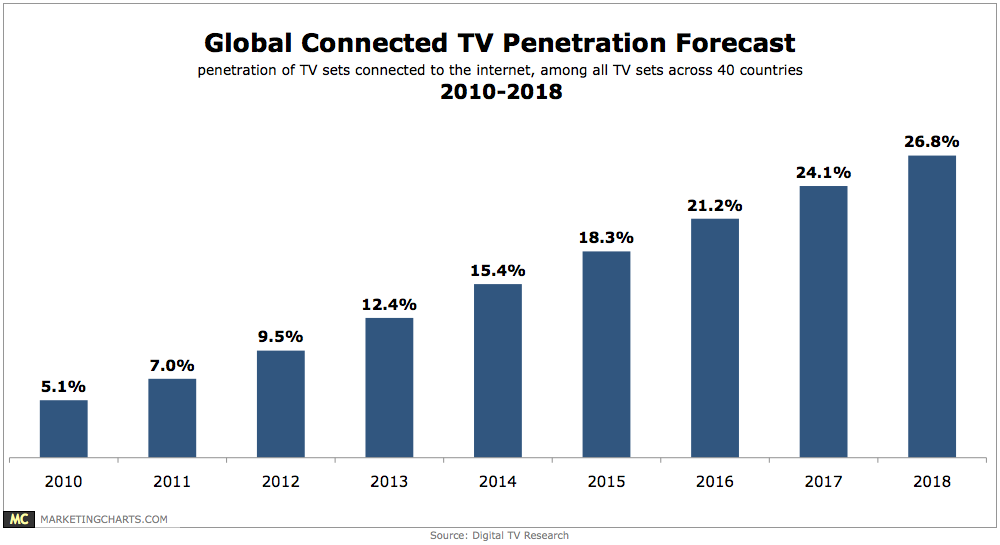
Read MoreGlobal Connected TV Penetration Forecast, 2010-2018 [CHART]
About 1 in 10 TV sets across 40 countries around the world were connected to the internet last year.
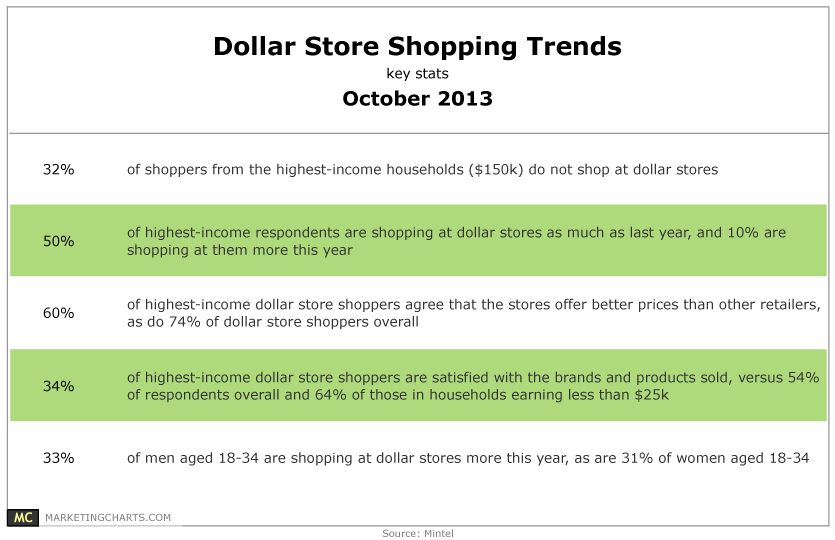
Read MoreDollar Store Shopping Trends, October 2013 [TABLE]
Only one-third of shoppers from the highest-income households ($150k+) say they don’t visit dollar stores, while most are frequenting the stores as much or more than they did last year.
Read MoreGlobal Email Marketing Open & Click Rates, Q1-Q4 2013 [CHART]
Consumers opened a whopping 19.6% of Friday marketing emails, giving that day the second highest email open rate of the week.
Read More