Consumer Behavior
Reasons To Use Branded Mobile Apps By Demographic, February 2013 [TABLE]
A full 50% of US mobile device users said they used branded mobile apps in order to receive discounts and coupons.
Read MoreFacebook Brands Response Rates, Q2 2012-Q3 2013 [CHART]
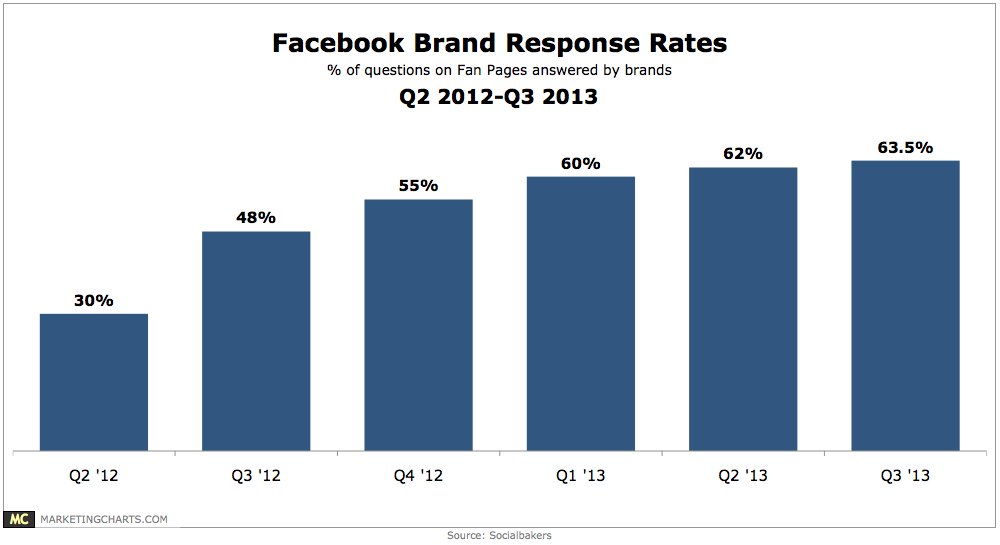
76% of the world’s most “socially devoted” brands believe that social customer service is an ROI driver.
Read MoreAmericans Prioritizing Quality Over Price By Demographic, October 2013 [CHART]
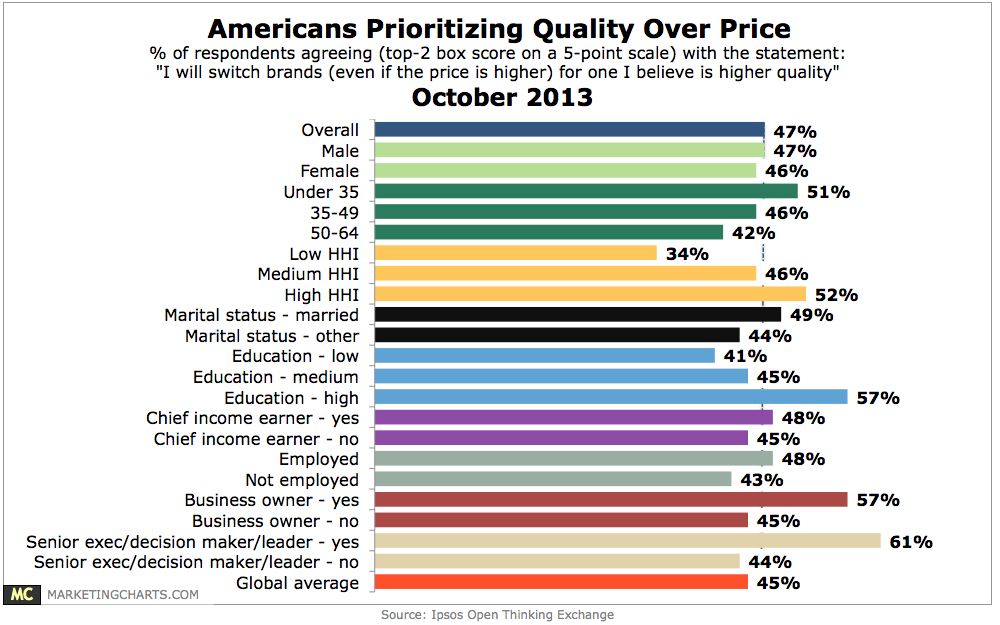
47% of Americans agree that they would switch brands for one they believe is higher quality, even if the price is higher.
Read MoreDesktop vs. Mobile Retail Website Visits By Day Of The Week, October 2013 [CHART]
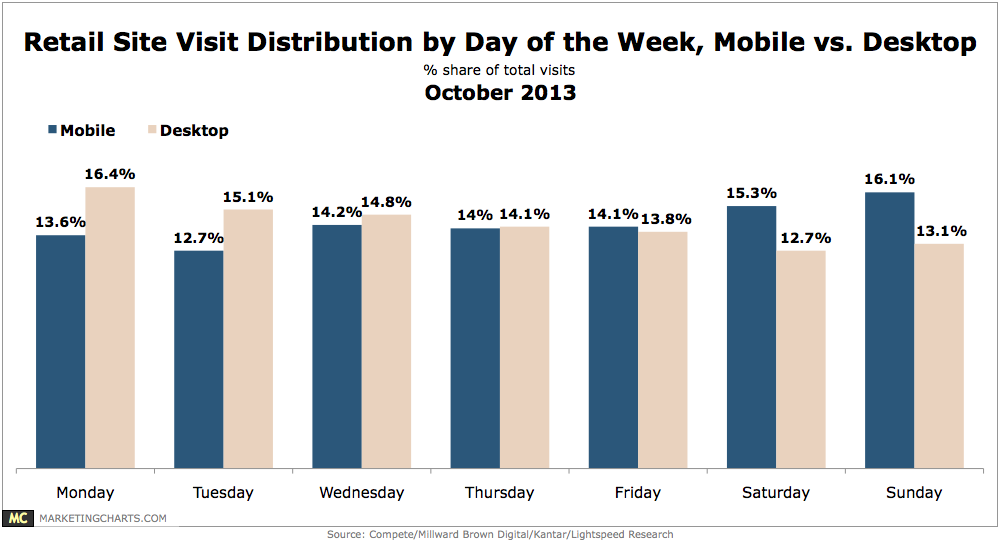
While Mondays and Tuesdays are the primary days for desktop visits (at a combined 31.5% share of total visits), Saturdays and Sundays are the most active days for mobile, with a combined 31.4% share of visits (versus 25.8% for desktops).
Read MoreDesktop vs Mobile Retail Website Visits By Daypart, October 2013 [CHART]
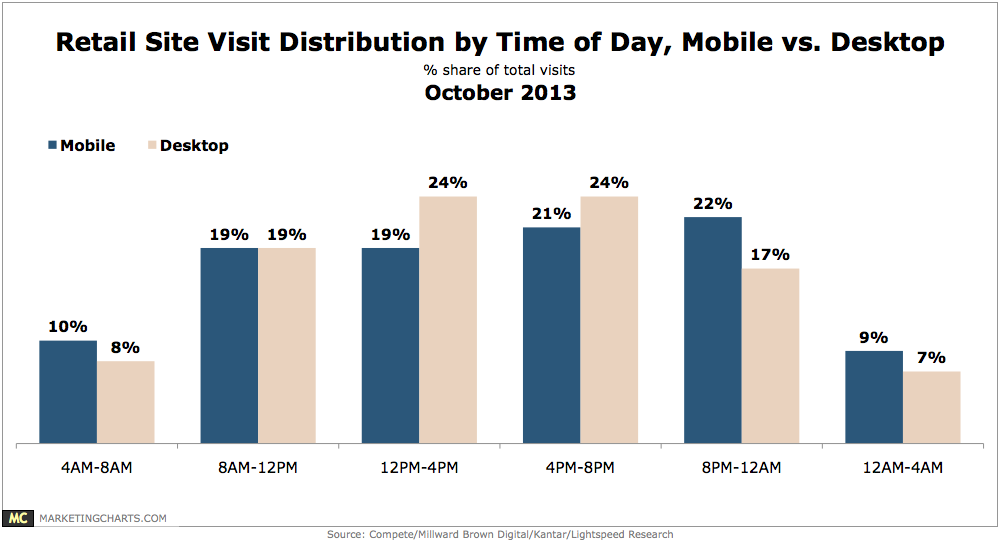
Almost half – 48% – of site visits from desktops occur between noon and 8 PM, compared to 40% of mobile visits.
Read MoreOver-The-Top Video Viewing Among Hispanic Households, October 2013 [CHART]
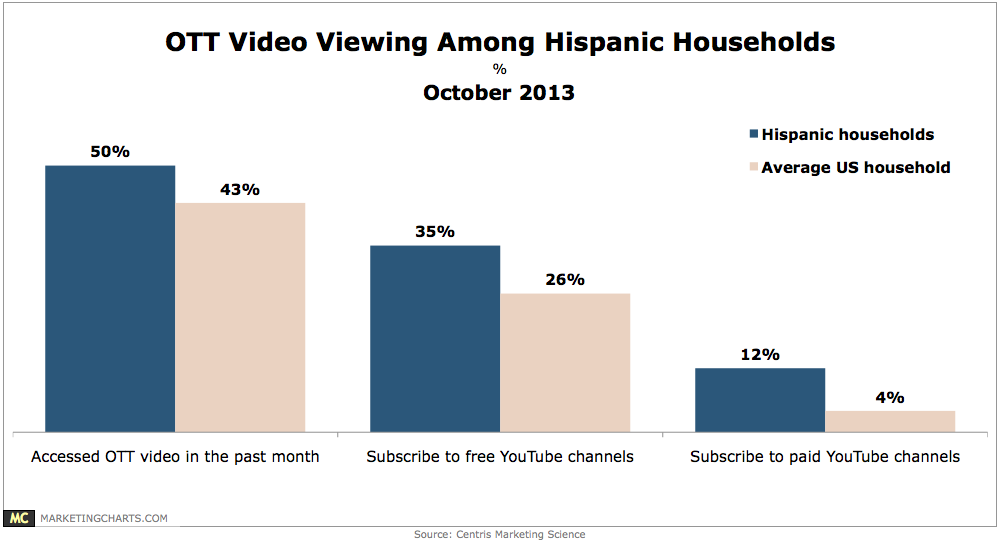
Hispanics are watching less traditional TV on a year-over-year basis, per Nielsen data, but they seem to be quite keen on over-the-top (OTT) content.
Read MoreWhat Service Providers Could Do To Prevent Customers From Switching, October 2013 [CHART]
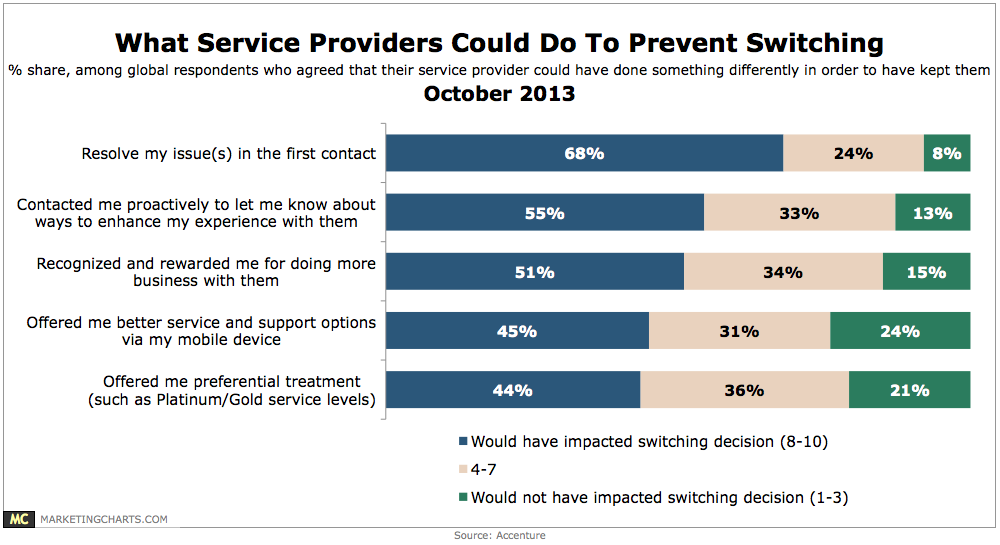
66% of consumers from 32 countries report having switched a service provider (from any 1 of 10 industries measured) during the past year.
Read MoreLife Insurance Customers Preference For Physical vs. Digital Channels, 2012 [TABLE]
Offline channels were strongly preferred for activities that helped consumers gain trust in their insurer, such as answering questions, receiving quality advice and providing convenience.
Read MorePreferred Customer Channel For Insurance-Related Activities, 2013 [TABLE]
When it came to using insurance products or researching new ones, the highest number of customers preferred to do so online.
Read MoreChange In Time Spent On Facebook By Age, June 2013 [CHART]
41% of Facebook users ages 16 to 18 spent less time on the site in the previous year, and 35% said they expected to use it less in the upcoming year.
Read More