Consumer Behavior
Social TV Behavior, Q1-Q3 2013 [CHART]
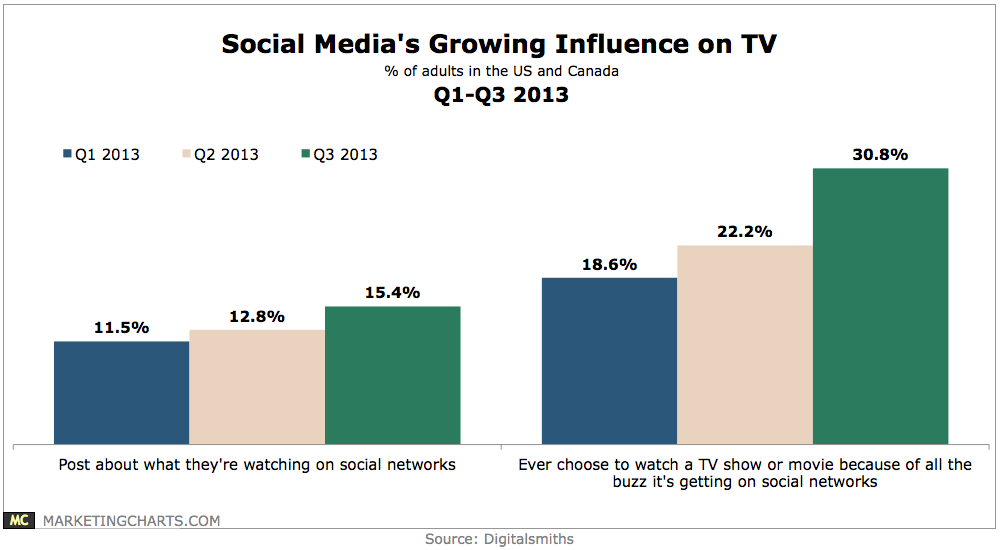
During Q3, 15.4% of adult respondents in the US and Canada claimed to post about what they’re watching, up from 12.8% in Q2 and 11.5% in Q1.
Read MoreSatisfaction Loyalty Program Features, December 2013 [CHART]
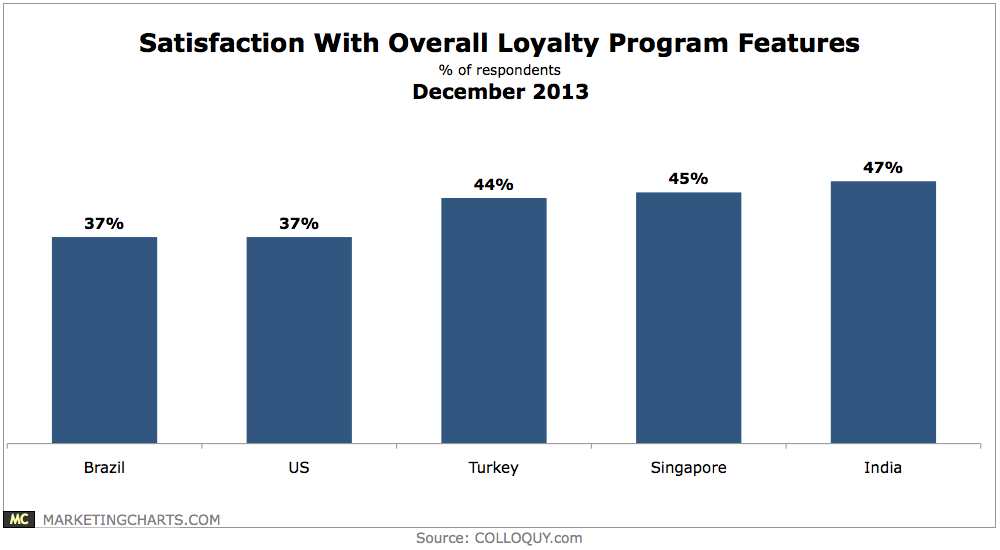
Fewer than half of the respondents in Brazil, India, Turkey and Singapore voiced their satisfaction with loyalty program benefits.
Read MoreMobile Shopping & Mobile Offers, December 2013 [TABLE]
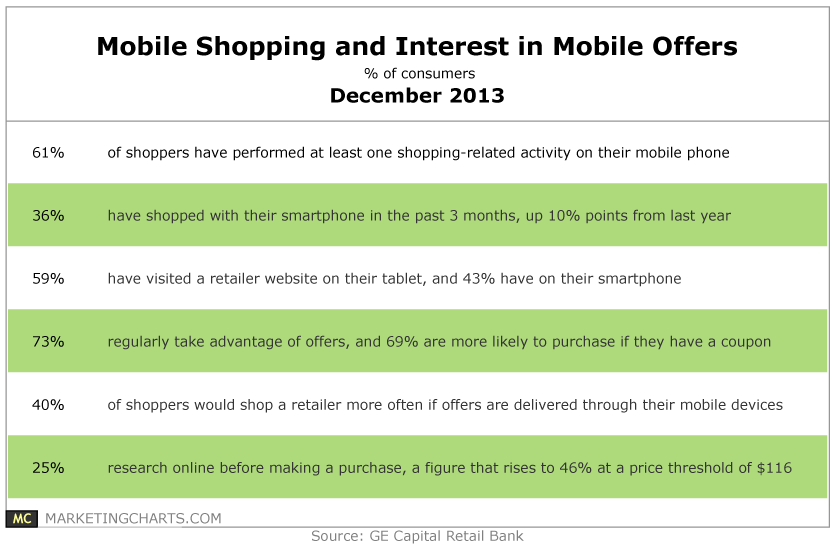
61% of respondents have performed at least a single shopping-related task on their mobile phone, and 36% have shopped on their smartphone at some point during the last 3 months.
Read MoreSocial Shares Driven By Top 3 Viral Videos Ads, 2006-2013 [CHART]
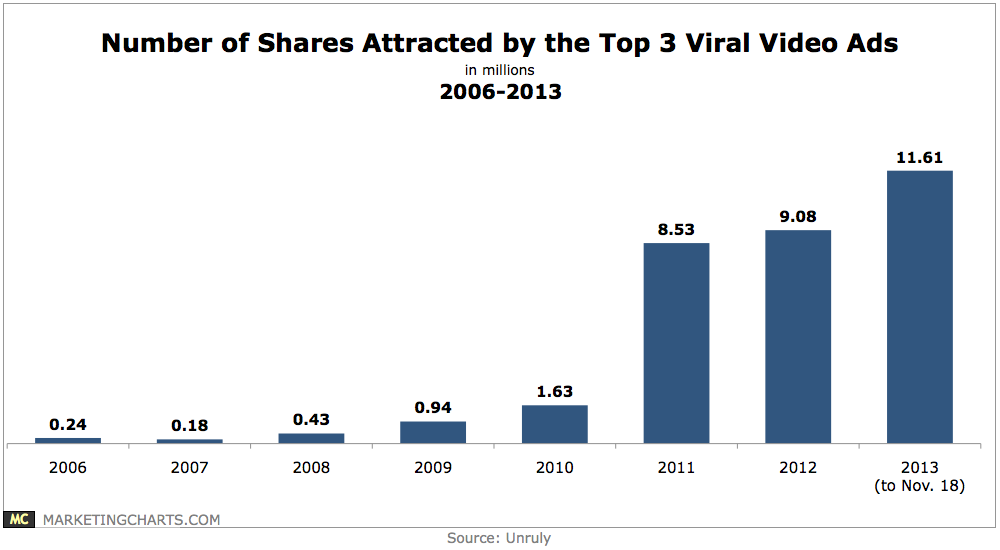
This year’s top 3 ads (through November 18) have generated 11.6 million shares, up from 1.6 million in 2010 and less than one-quarter of a million in 2006.
Read MoreBrand Advocacy Rankings, December 2013 [TABLE]
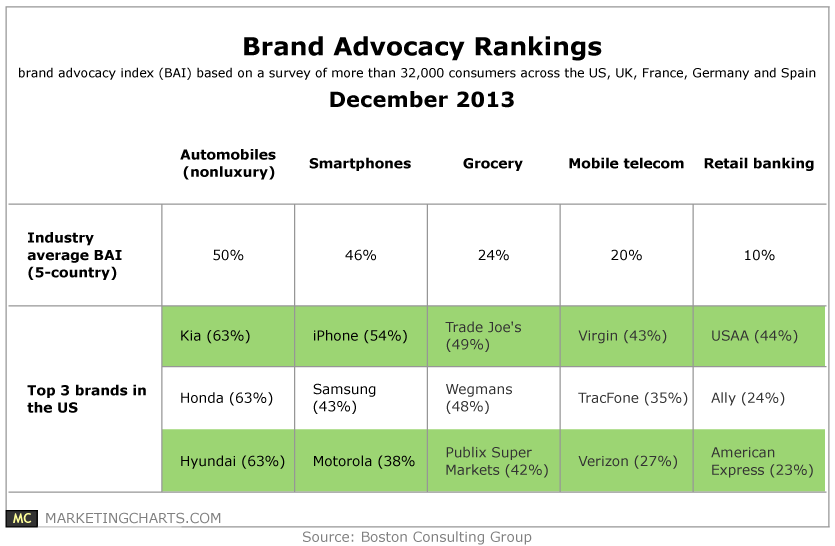
Among the sample of brands studied, the average difference between the top-line growth of the highest- and lowest-scoring brands was 27% points.
Read MoreUnaided Brand Recall For Online Video By Device, June 2013 [CHART]
Millennial video viewers recalled ads with less frequency than did Gen Xers, no matter what device was being used to watch content.
Read MoreHow People Watch Mobile Online Video by Device & Generation, June 2013 [TABLE]
Video apps emerged as a popular means of watching digital videos across all age demographics.
Read MoreTypes Of Online Video Viewed By Generation, June 2013 [TABLE]
Millennials were more likely to watch digital videos in almost all content categories than their older counterparts.
Read MoreBenefits Of Real-Time Marketing, April 2013 [CHART]
When it comes to real-time efforts, marketers hope to drive increases in engagement with their often-elusive audience.
Read MorePay-TV & Streaming Service Subscriptions, December 2013 [CHART]

Three-quarters of American adults claim to subscribe to a cable (52%) or satellite (24%) TV service.
Read More