Consumer Behavior
When Americans Will Consider Buying Wearable Tech By Demographic, November 2013 [TABLE]
Hardly anyone has a wearable tech device just yet,—just 3% of US internet users—and signs don’t point to that changing without some major changes.
Read MoreTop TV Programs Of 2013 [TABLE]

As in 2011 and 2012, this year’s top TV programs were almost exclusively the realm of NFL telecasts.
Read MoreHoliday Desktop Retail eCommerce Sales Through December 15, 2012 vs 2013 [CHART]
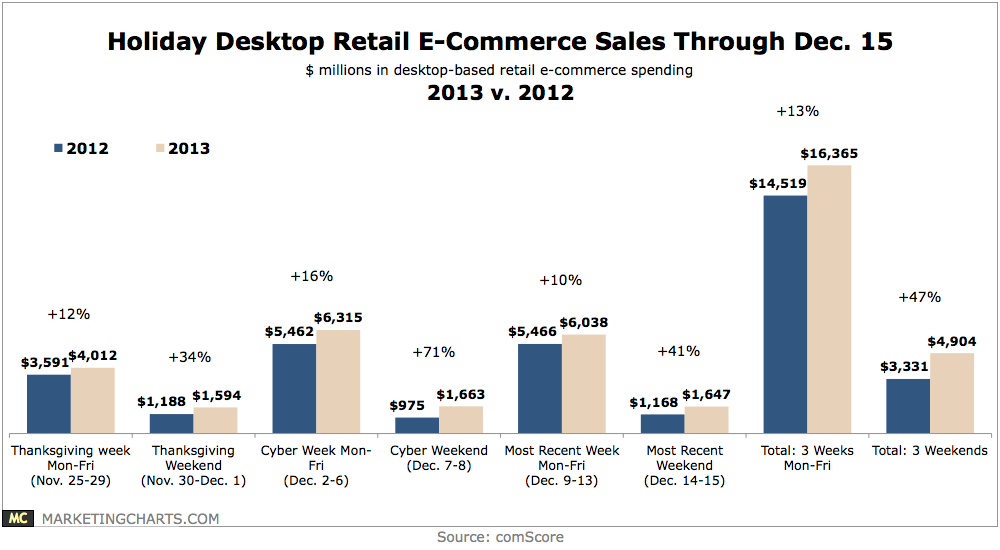
Mobile shopping may be on the rise this holiday season, but that doesn’t appear to be affecting desktop e-commerce sales.
Read MoreFrequency With Which People Check Their Mobile Bank Statements, October 2013 [TABLE]
53% of Germans checked their mobile bank statement several times a week.
Read MoreFrequency With Which People Check Their Online Bank Statements, October 2013 [TABLE]

Banking customers from all four countries were not resistant to checking their online bank statements with relatively high frequency.
Read MoreHow People Get Their Bank Statements Worldwide, October 2013 [TABLE]
There was no clear uniformity among the countries in terms of customer preference for online or printed statements.
Read MoreGen X Social Network User Penetration, 2013 & 2017 [CHART]
Three-quarters of US Gen X internet users will log on to social networks at least monthly in 2013.
Read MoreGoogle’s Top Search Trends of 2013 [TABLE]
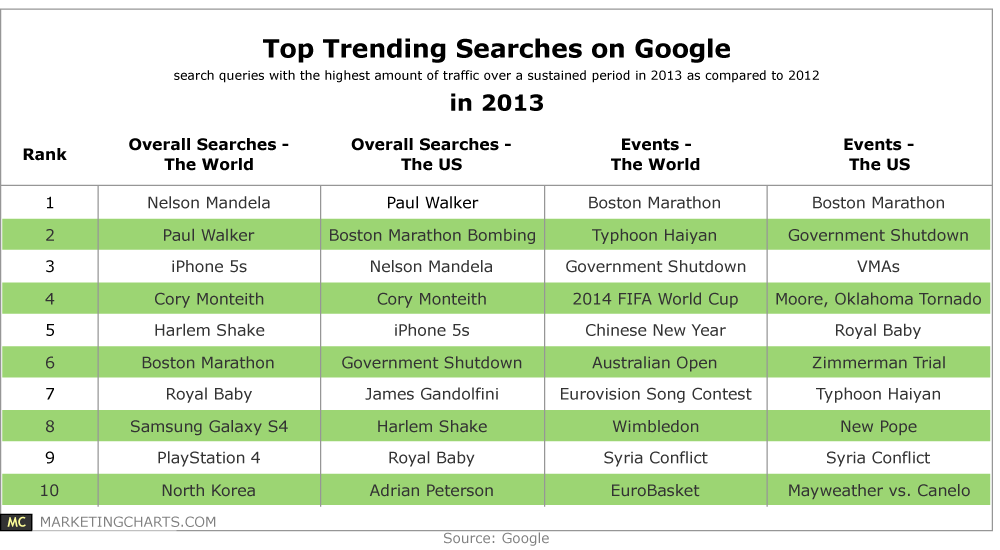
The top search trends were a mix of tragedies, technology, and yes, a video sensation that spawned countless imitations.
Read MoreAverage Number Of Friends/Followers Women Have On Social Networks, August 2013 [CHART]
Women had an average of 250 connections on Facebook, vs. 163 on Twitter and just 89 on Instagram.
Read MoreAverage Time Women Spend on Social Networks, August 2013 [CHART]
79% of women ages 25 to 54 used Facebook regularly, compared with a dramatically lower 35% who said they regularly visited YouTube, 30% who said the same of Pinterest, 22% for Twitter, and just 13% for Instagram.
Read More