Consumer Behavior
Types Of Online Reviews, January 2014 [CHART]
79% of online Americans checked online reviews at least some of the time before making a purchase.
Read MoreNew Product First Adopters By Demographic, January 2014 [TABLE]
Millennial males were the most inclined to share photos and thoughts each time they tried a new product or service.
Read MoreFrequency With Which People Share Information About New Products On Social Media [TABLE]
The majority of posts on social networks about new products and services came from women, especially those 44 and younger.
Read MoreLikelihood Of Purchase Based On Friend's Social Media Post, January 2014 [TABLE]

68% of 18-to-34-year-old social media users surveyed were at least somewhat likely to make a purchase after seeing a friend’s post.
Read MoreWorking Moms' Traditional Media & Lifestyle Habits, February 2014 [TABLE]
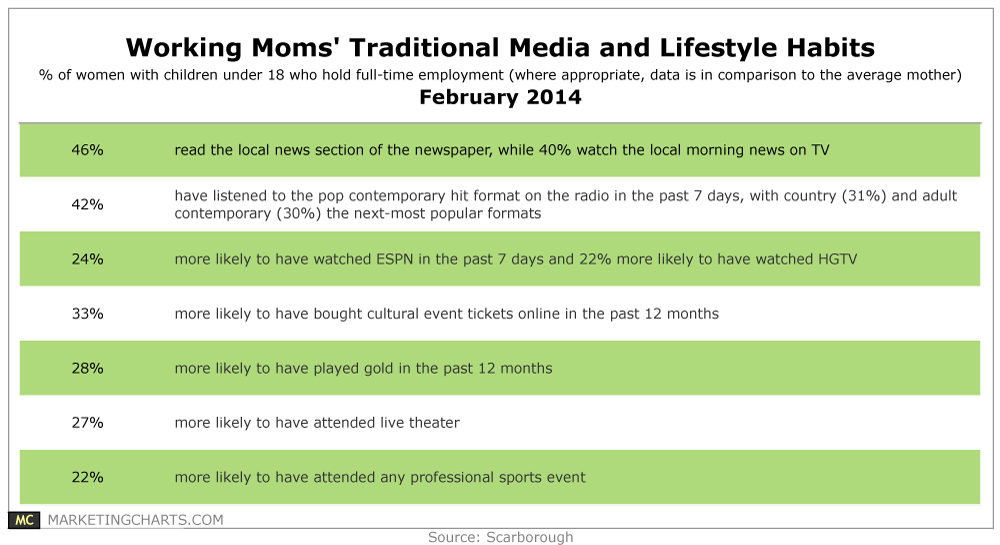
Working mothers – those 40% of women who have children under the age of 18 and also hold full-time employment – are both educated and affluent.
Read MoreFacebook Brand Page Reach By Age, 2013 [CHART]
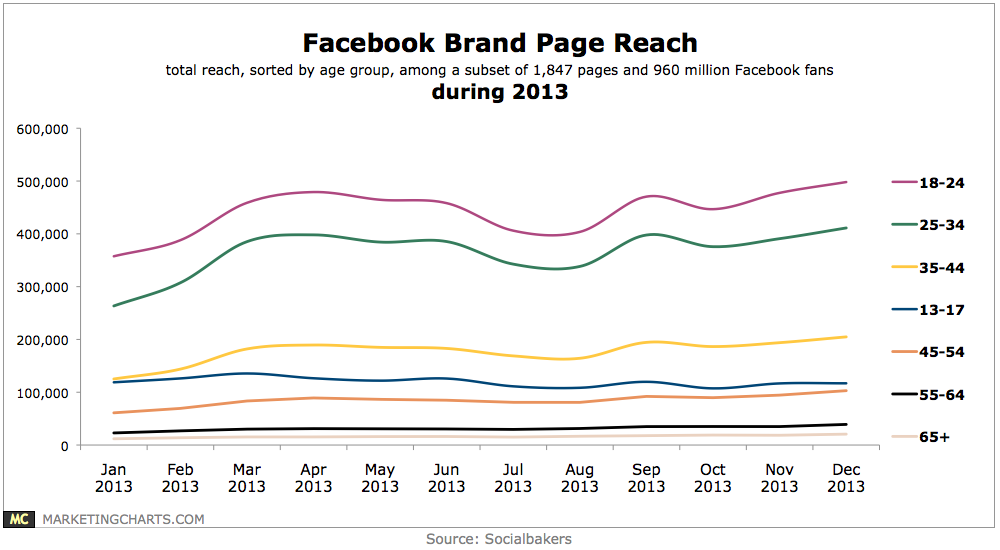
Reach among 18-24-year-olds ended the year about 39% higher than it started.
Read MoreOnline TV Show Sources Used By Primetime TV Viewers, January 2014 [CHART]
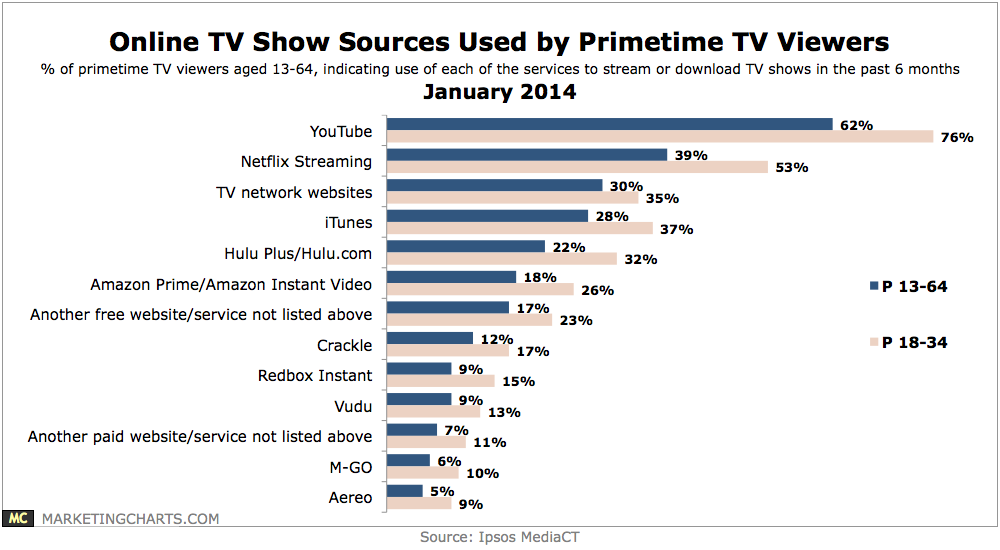
3 in 4 primetime TV viewers between the ages of 13 and 64 have used an online service to stream or download TV shows during the past 6 months.
Read MoreHow People Find New Mobile Apps, March 2013 [CHART]
55% of US smartphone users typically browsed the app store to find new mobile apps.
Read MoreGlobal Mobile App Downloads, 2013 & 2017 [CHART]
Portio Research estimated the number of annual downloads would top 200 billion in 2017—two-and-a-half times 2013’s 82 billion.
Read MoreAmerican Tablet Adoption By Demographic As Of January 2014 [CHART]
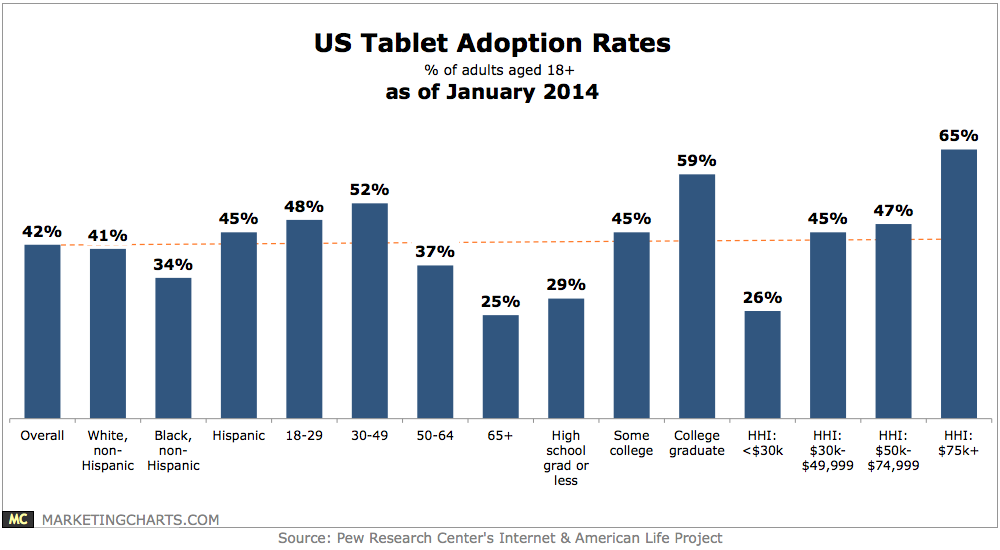
The 30-49 age group continues to have the highest tablet adoption rate – of 52% – although the 18-29 demo has closed the gap by virtue of its 48% penetration rate.
Read More