Consumer Behavior
Consumer Comfort With Communicating With Brands By Channel, June 2014 [CHART]
93% are comfortable getting contacted from brands and suppliers via email.
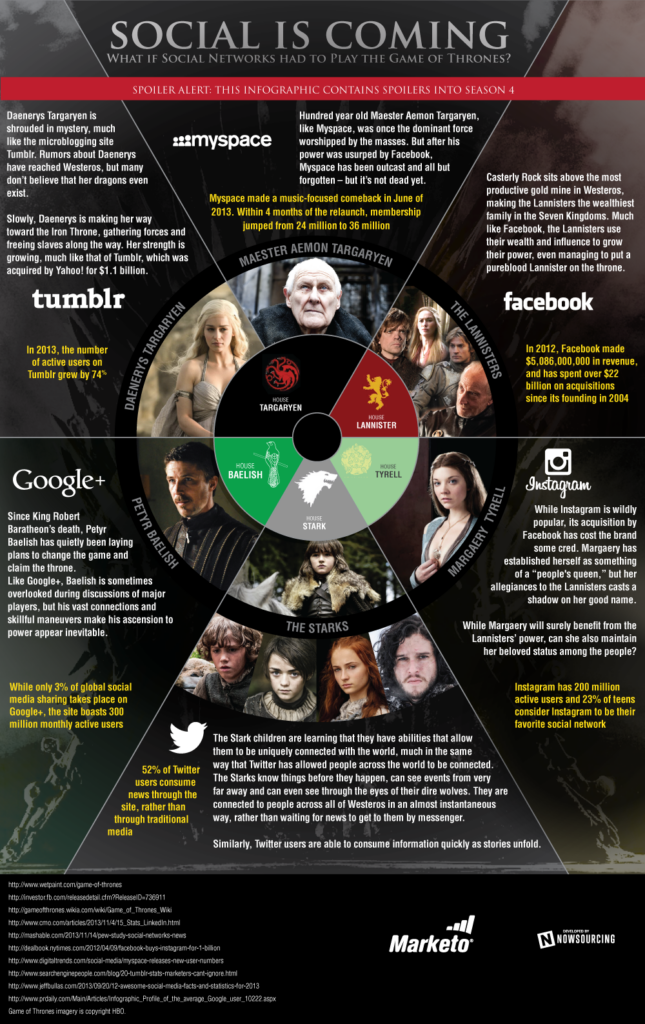
Read MoreSocial Networks Play The Game Of Thrones [INFOGRAPHIC]
This infographic from Marketo imagines the social networks playing Game of Thrones.
Read MoreProducts & Services South Africans Buy Online, December 2013 [TABLE]
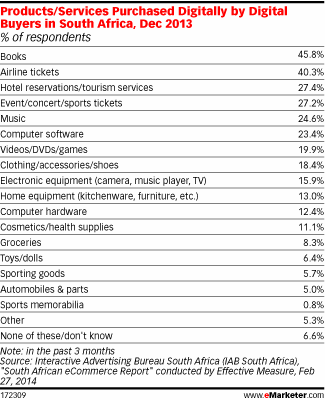
Books and items related to travel and entertainment were the top products and services purchased online by digital buyers in South Africa.
Read MoreFrequency With Which South Africans Make Online Purchases, December 2013 [CHART]
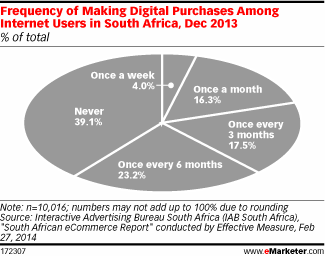
Digital buying wasn’t too frequent of an activity, with just 4.0% and 16.3% of internet users saying they did so once a week or month, respectively.
Read MoreGeneration V Media Consumption By Age & Channel, July 2013 [TABLE]
TV remains the biggest single element of Generation V’s media usage.
Read MoreMeetings [INFOGRAPHIC]
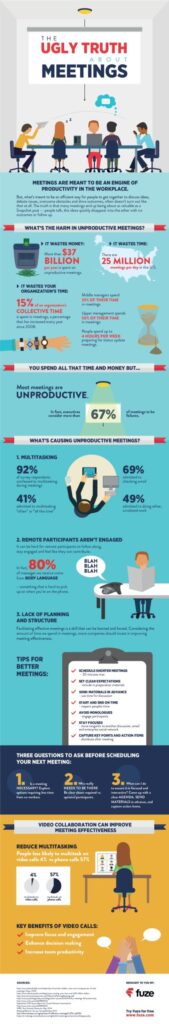
This infographic from Fuze illustrates some surprising facts about meetings.
Read MoreOnline Optimization Conversion Rates, June 2014 [TABLE]
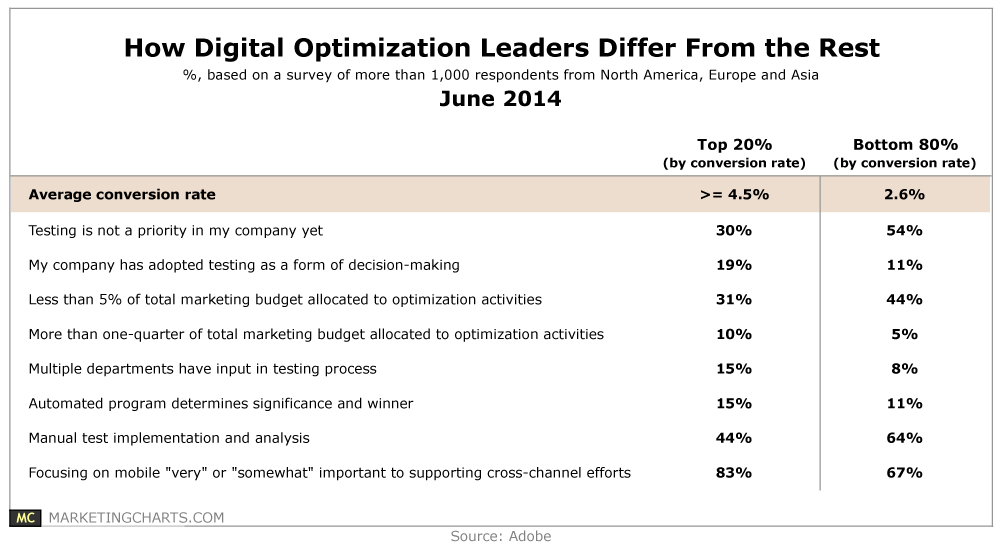
Increasing conversion rates is a top digital priority for marketers this year.
Read MoreMobile Users Most Important Devices For Information, June 2014 [CHART]
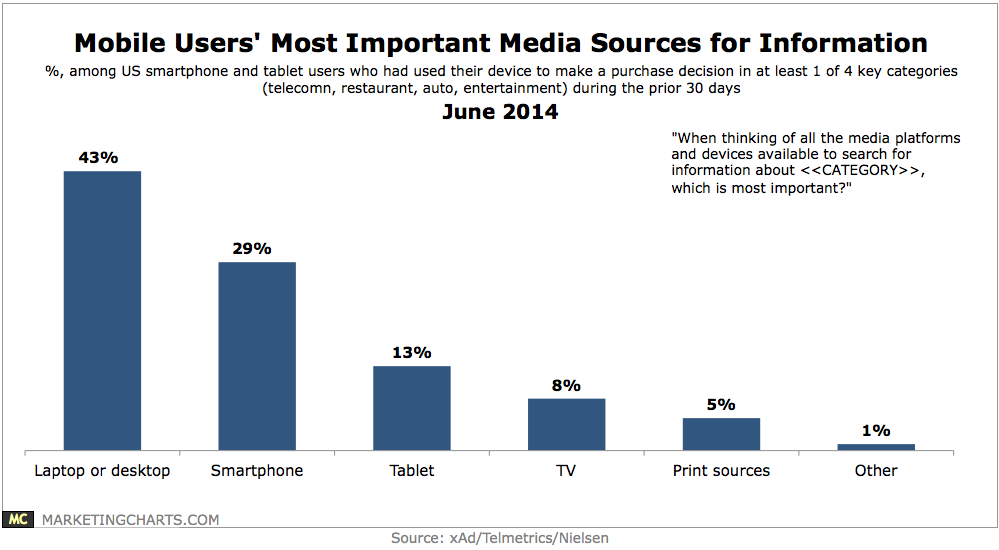
Some 29% named their smartphone the most important media platform when searching for information during the purchase process, up from 23% the prior year.
Read MoreInfluences Over Completing Purchases, June 2014 [CHART]
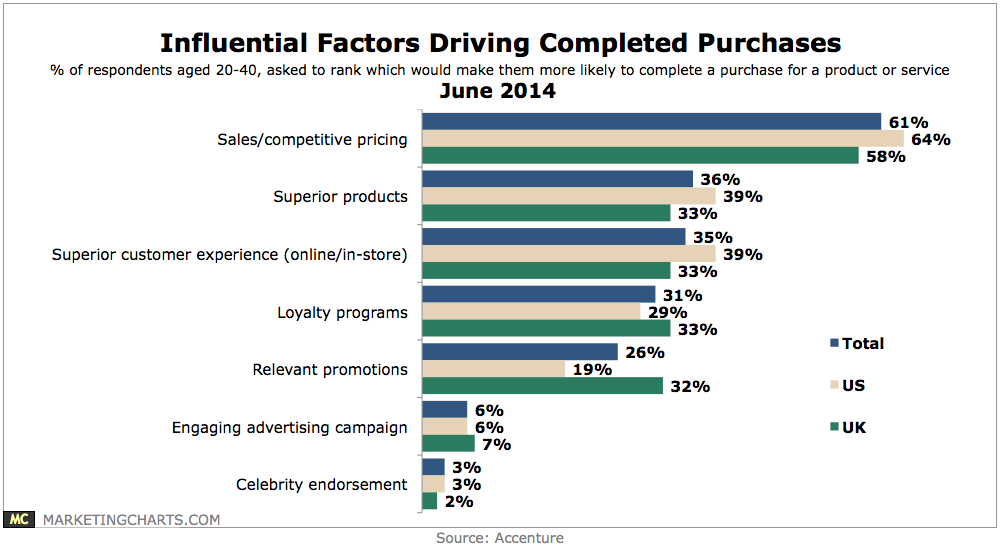
Consumers aged 20-40 in the US and UK were asked to rank the factors that would make them most likely to complete the purchase of a product or service, with sales and competitive pricing (61%) by far their most critical.
Read MoreSmart Phone Share Of Mobile Market, October 2011 – April 2014 [CHART]
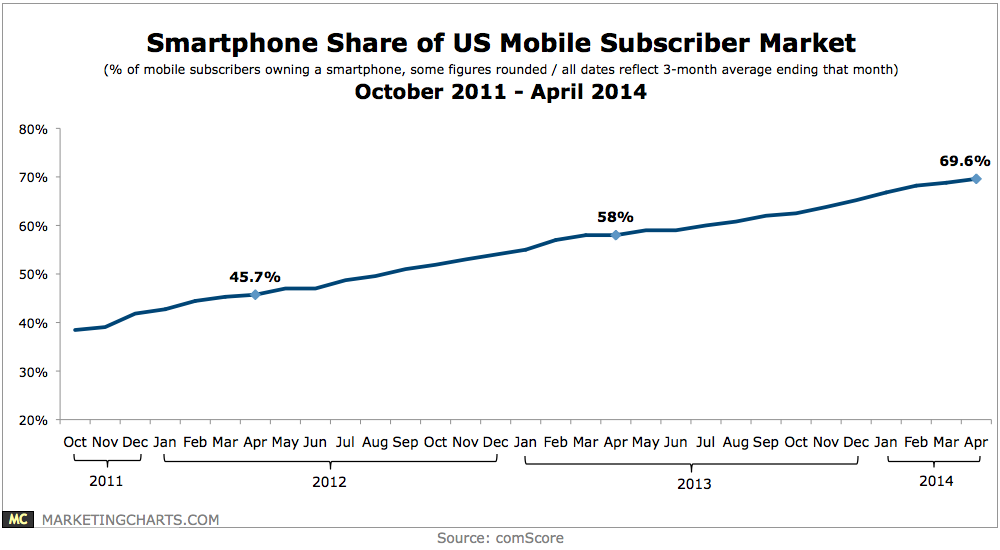
Smartphone penetration averaged 69.6% of the US mobile market during the 3-month period ending in April 2014, up more than 10 points from the year-earlier period (58%).
Read More