Consumer Behavior
America's Most Patriotic Brands, 2013 vs 2014 [TABLE]
Jeep’s leading score of 98% (for the second consecutive year) means that it almost fully meets consumers’ emotional ideal for patriotism in the auto category.
Read MoreWorld Cup 2014 Sponsor Brand Recall By Demographic, June 2014 [CHART]
Only 36% of American adults can correctly identify at least one official sponsor for the World Cup, with men significantly more able to do so than women (44% vs. 29%).
Read MoreDaily Social Media Activity On Computers & Mobile Phones, June 2014 [CHART]
Some 46.5% of respondents said they read or update Facebook daily from a computer, with 29.3% doing so daily from a mobile phone.
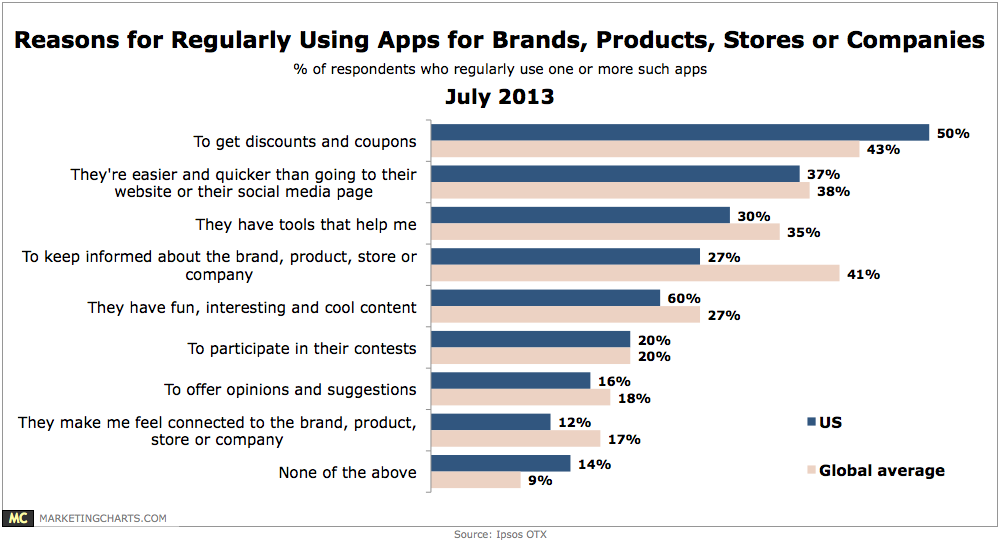
Read MoreAttitudes Toward Brands That Use In-App Marketing In Free Mobile Apps, January 2014 [TABLE]
When asked what type of ads would cause them to view a brand negatively, just 6% of respondents cited rewards.
Read MoreTolerance Toward In-App Marketing In Exchange For Free App, January 2014 [CHART]
Though 63% of US smartphone app users said they knew mobile ads were necessary, they were far more likely to prefer rewards: 84%.
Read MoreMobile In-App Ad Preferences, March 2014 [CHART]
More than two-thirds of US smartphone owners surveyed said that if they had to see in-app advertising, being offered a reward for viewing or engaging with an ad was their top preference.
Read MoreWays Consumers Want Companies Tell Them About Their Personal Data, April 2014 [CHART]
Just 35% of US internet users thought businesses were transparent enough about how they used personal information.
Read MoreTop US Retail Data Breaches, 2003-2014 [CHART]
There has always been some degree of concern over digital privacy and personal data, but until recently, consumer attitudes had remained relatively steady.
Read MoreSenior Execs Use Of Smart Phones, June 2014 [CHART]
More than 9 in 10 senior executives own a smart phone used for business.
Read MoreUS News Consumers Top News Topics, June 2014 [CHART]
US news consumers (those who consume some type of news on a monthly basis) are most interested in national and local news (each at 57%).
Read More