Consumer Behavior
US Marketing Research Industry Trends, 2007-2014 [CHART]
The Research Industry Index (RII), an indicator of business activity in the industry, posted a score of 100 in Q1 2014, the 4th consecutive quarter of 100 or higher.
Read MoreMobile Video App Use By Age Group, July 2014 [CHART]
Not surprisingly, late Millennials (18-24) are the most likely to be using a mobile video application at least once a month.
Read MoreFacebook Active Mobile Monthly Users & Ad Revenues, Q3 2012 – Q2 2014 [CHART]
Facebook’s advertising revenues grew by 67% year-over-year in Q2 to almost $2.7 billion.
Read MoreEye Tracking Technology & Web Design [INFOGRAPHIC]
This infographic illustrates the fundamentals of how eye tracking technology can inform website design.
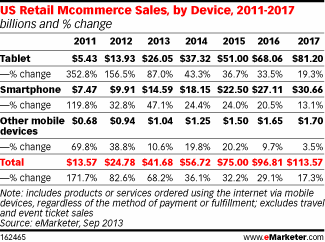
Read MoreUS Retail mCommerce Sales, 2012-2018 [TABLE]
Apps may be where mobile users spend most of their time—86.0% of US smartphone internet time was spent in apps in 2013.
Read MoreTrust & Relevance's Effect On Email Marketing Success, July 2014 [TABLE]
Consumers only have 4-5 brands that they always open emails from.
Read MoreCMOs Attitudes Toward Collaboration With CIOs, July 2014 [CHART]
83% of IT executives feel a need to align and interact with marketing (up from 77% in 2012) and 69% of marketing executives feel the same way about IT (up from 56% in 2012).
Read MoreCustomer Satisfaction With Social Networking Sites, 2013 vs 2014 [CHART]
Customer satisfaction with social media websites improved by 3 points year-over-year to an average score of 71 on the ACSI’s 100-point scale.
Read MoreTop Objectives For Marketing Automation, July 2014 [CHART]
The most commonly-cited objectives were improving marketing productivity (45%), increasing sales revenue (44%).
Read MorePrimary B2B Content Marketers Practices, July 2014 [CHART]
Only 1 in 7 B2B marketing leaders believe that their content marketing efforts have very effectively delivered business value during the past 12 months.
Read More