Consumer Behavior
New Smart Devices Activated Christmas Week By Type, 2012-2014 [CHART]
Phablet devices activated worldwide during the week of Christmas accounted for 13% of total activations—up 225% year over year.
Read MoreTop 5 Smart Device Brands Activated During Christmas Week, 2014 [CHART]
Apple accounted for 51.3% of device activations between December 19 and 25, 2014.
Read MoreMagazine Industry Social Media Like/Follower Share By Network, October 2014 [CHART]
Facebook’s share of Likes and Followers worldwide of US magazine brands on social networks was nearly 50%.
Read MoreUnique Visitors To Financial Services Facebook Pages, June & September, 2014 [TABLE]
Payment services maintained the highest number of monthly unique engaged visitors during the six months as the total more than sextupled.
Read MoreShare Of Social Engagement On Financial Service Brand Pages, October 2014 [CHART]
Nearly three-quarters (72%) of US financial services brands tracked on the Sharablee social analytics company’s platform had a social network presence.
Read MoreAppeal Of Same-Day Delivery By Generation [CHART]
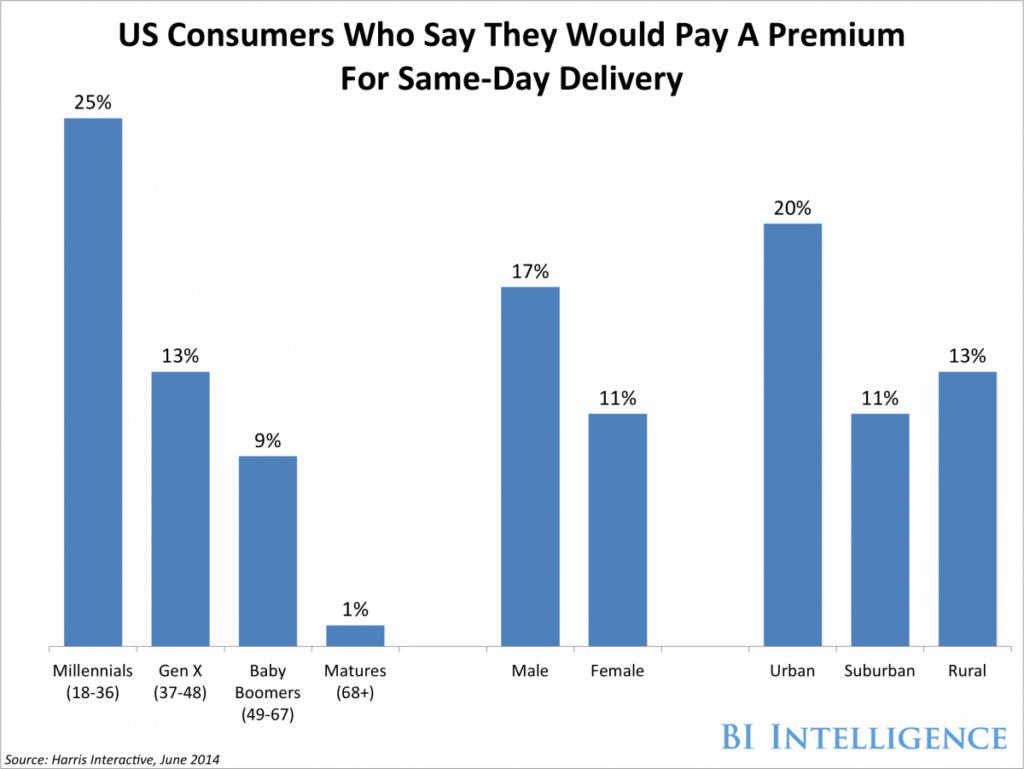
While same-day delivery comes with a big price tag, 25% of millennials said they would pay a premium for same-day delivery.
Read MoreExpected Apple Watch Shipments for 2015 [CHART]
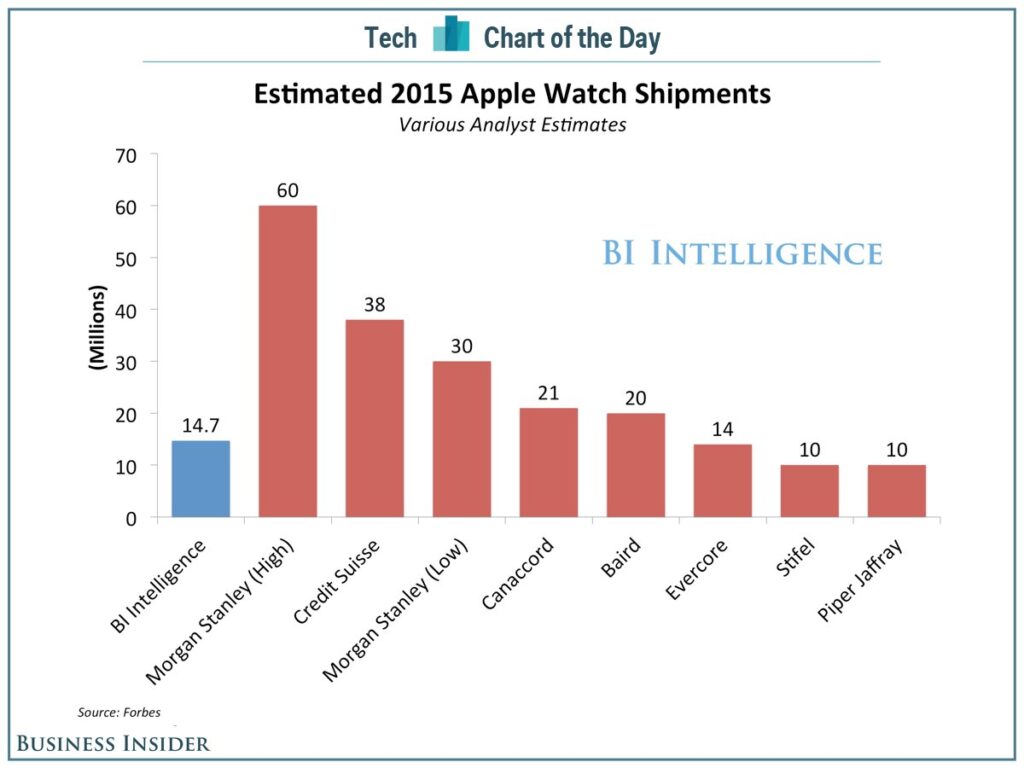
Expectations for Apple Watch shipments this year are all over the map.
Read MoreDisplay Ad Viewability Rates By Ad Size, July 2014 [CHART]
Vertical ad units were consistently the most viewable. Worldwide, 120×240 placements performed the best for viewability, with a rate of 55.6%.
Read MoreMobile Display Ad Viewability Metrics By Ad Size, Q3 2014 [TABLE]
Screenwide display ads on mobile were tops for viewability.
Read MoreDesktop Display Ad Viewability & Engagement Metrics By Ad Size, Q3 2014 [TABLE]
970×250 ads had the highest in-view rate out of desktop display ads studied worldwide during Q3 2014, at 65.8%.
Read More