Consumer Behavior
State Of The Internet, 2015 [MARY MEEKER PRESENTATION]
Mary Meeker’s annual State of the Internet report was released today and, as usual, it is jam-packed with fascinating and useful stats on how we use online communications.
Read MoreNumber Of Podcasts People Listen To Weekly, February 2015 [CHART]
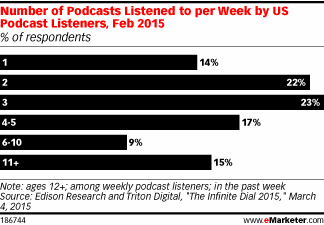
Weekly podcast listeners—estimated at approximately 27 million people—listened to an average of six podcasts per week.
Read MorePrimary Podcast Listening Device, 2014 vs 2015 [CHART]
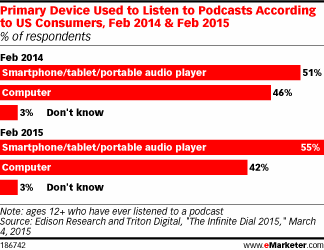
Fully 55% of US consumers ages 12 and older who had ever listened to a podcast said they used a smartphone, tablet or portable audio player most frequently to do so.
Read MoreHow People Use Mobile Payments, May 2015 [CHART]
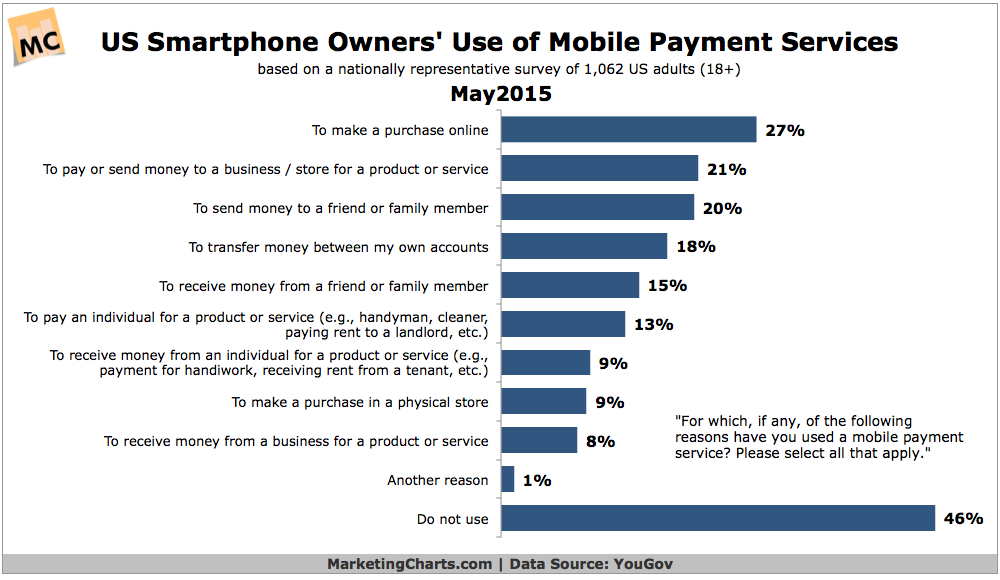
Some 91% of US adult smartphone owners have heard of a mobile payment service such as PayPal, Google Wallet and Apple Pay.
Read MoreSocial Video Advertising Metrics, April 2015 [CHART]
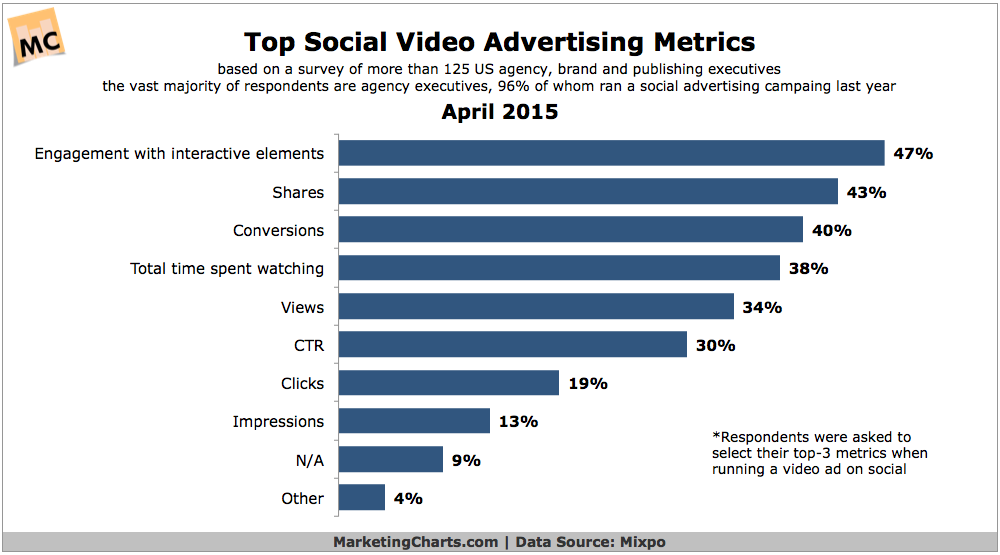
Advertisers running video ads on social media are more interested in metrics such as engagement with interactive elements and shares than they are with views.
Read MoreSwearing Customers [INFOGRAPHIC]
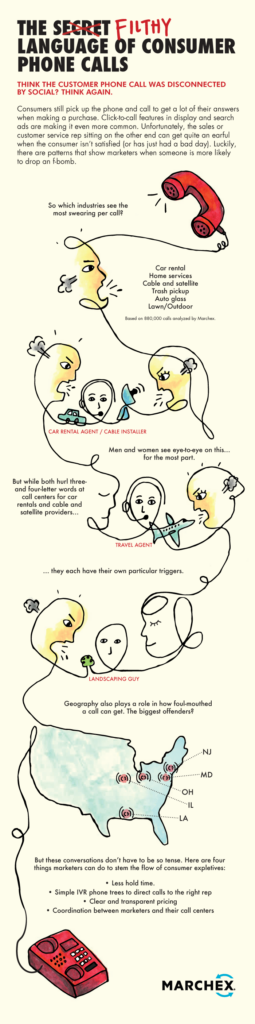
Swearing Customers Infographic: This infographic by Marchex illustrates the industries that earn the foulest-mouthed customers.
Read MoreB2B Social Media [INFOGRAPHIC]
This infographic by NowSourcing illustrates the countless ways that social media can be used in business-to-business communications.
Read MoreViewability Rates By Video Ad Dimensions, April 2015 [TABLE]
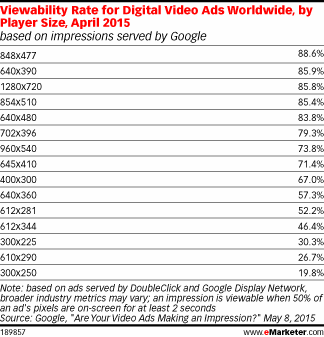
According to April 2015 research by Google, shelling out for larger ad sizes could help boost viewability.
Read MorePersuasion [INFOGRAPHIC]
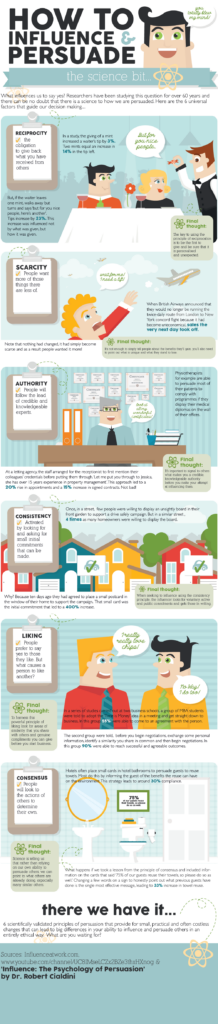
Persuasion Infographic: This infographic by everreach illustrates many of the psychological factors involved in persuasion and influence.
Read MoreHow Email Marketers Manage Customer Data, December 2014 [CHART]
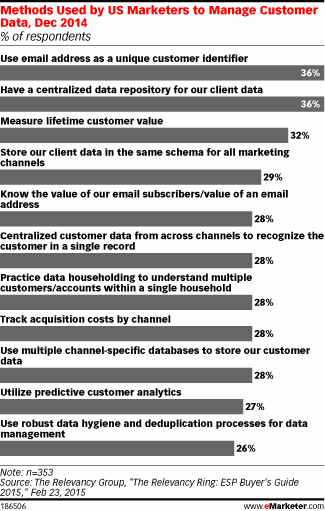
How Email Marketers Manage Customer Datat: Fewer than four in 10 email marketers had a centralized data repository for their client data.
Read More