Video Marketing
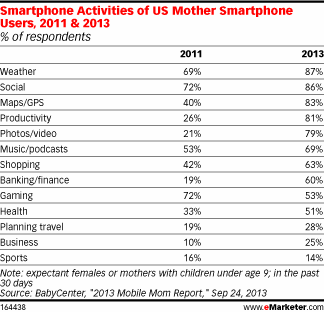
US Mothers' Smart Phone Activities, 2011 & 2013 [TABLE]
Escapism (39%), social (23%), and shopping (12%) were the most popular functions among mothers glued to their mobiles.
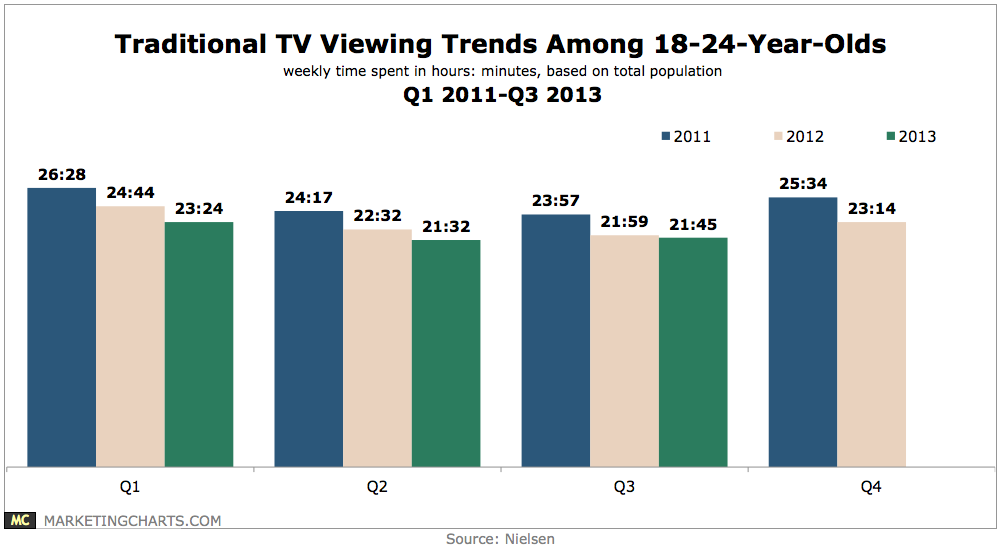
Read MoreTraditional TV Viewing Trends Among 18-24 Year Olds, Q1 2011-Q3 2013 [CHART]
While Millennials are indeed watching less TV, it’s not yet as precipitous a decline as one might be led to believe.
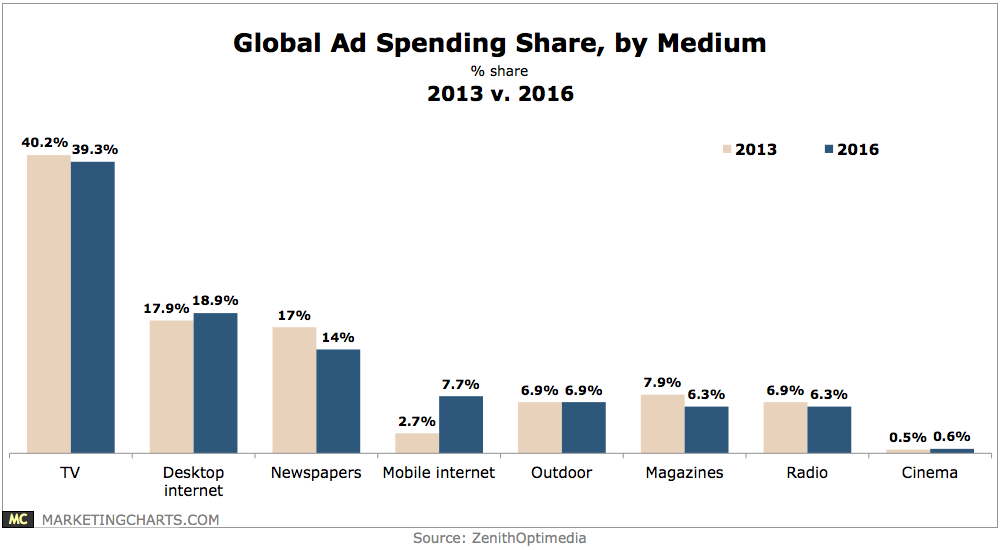
Read MoreGlobal Ad Spending Share By Medium, 2013 vs 2016 [CHART]
ZenithOptimedia predicts mobile advertising will generate more new ad spending ($31.8 billion) than TV ($29.8 billion) from this year through 2016.
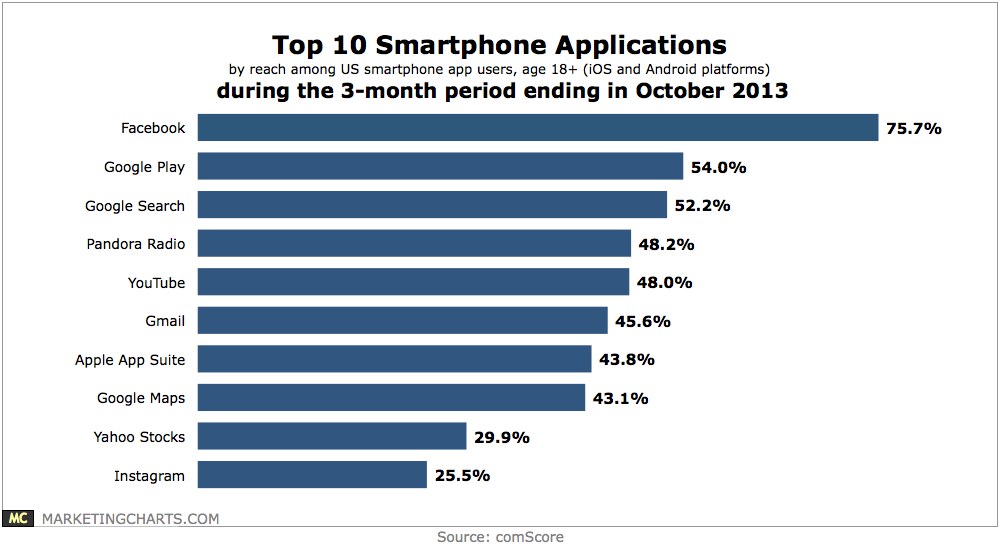
Read MoreTop 10 Smart Phone Apps, October 2013 [CHART]
With 25.5% reach among adult iOS and Android app users, Instagram ranked as the 10th-largest smartphone application during the 3-month period ending in October 2013.
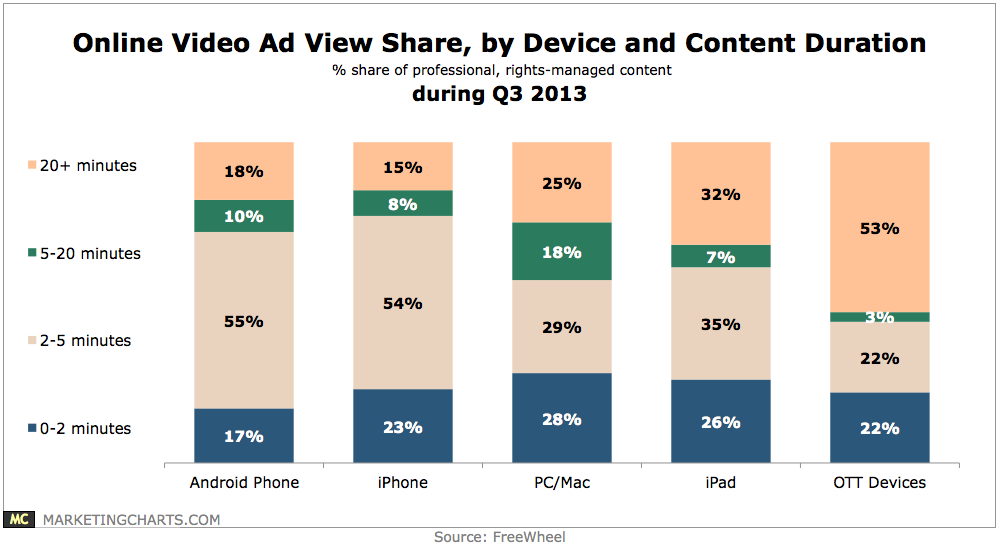
Read MoreOnline Video Ad View Share By Device & Content Duration, Q3 2013 [CHART]
During Q3, 72% of ad views on Android phones were derived from content less than 5 minutes in length, with the corresponding figure at 77% for iPhone users.
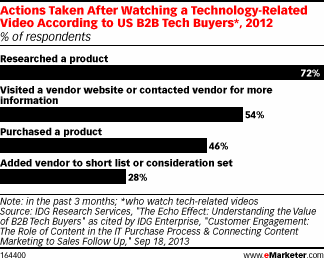
Read MoreB2B Tech Buyers' Actions Prompted by Tech-Related Video, 2012 [CHART]
Digital video, long an amusement for consumers, is nudging its way into the business-to-business (B2B) marketing mainstream.
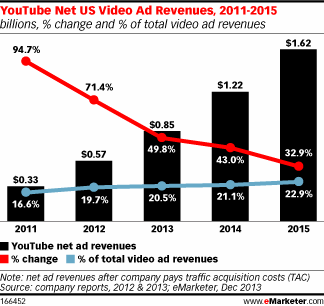
Read MoreYouTube Net US Video Ad Revenues, 2011-2015 [CHART]
YouTube’s revenues from video ad formats will hit $1.22 billion next year, claiming a 21.1% share of all US video ad revenues.
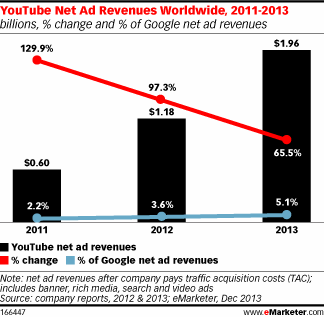
Read MoreGlobal YouTube Net Ad Revenues, 2011-2013 [CHART]
After paying back advertising partners and video content creators, eMarketer still expects the company to net $1.96 billion in ad revenues worldwide this year, up 65.5% over 2012.
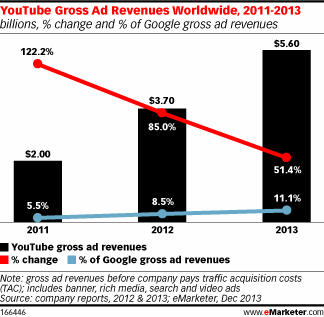
Read MoreGlobal YouTube Gross Ad Revenues, 2011-2013 [CHART]
YouTube will bring in about $5.60 billion in gross ad revenues this year.
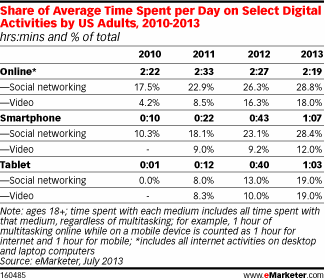
Read MoreShare Of Average Time Spent Per Day On Select Online Activities, 2010-2013 [TABLE]
Fragmented multiscreen media consumption has left marketers struggling to keep up or get a word in edgewise.
Read More