Video Marketing
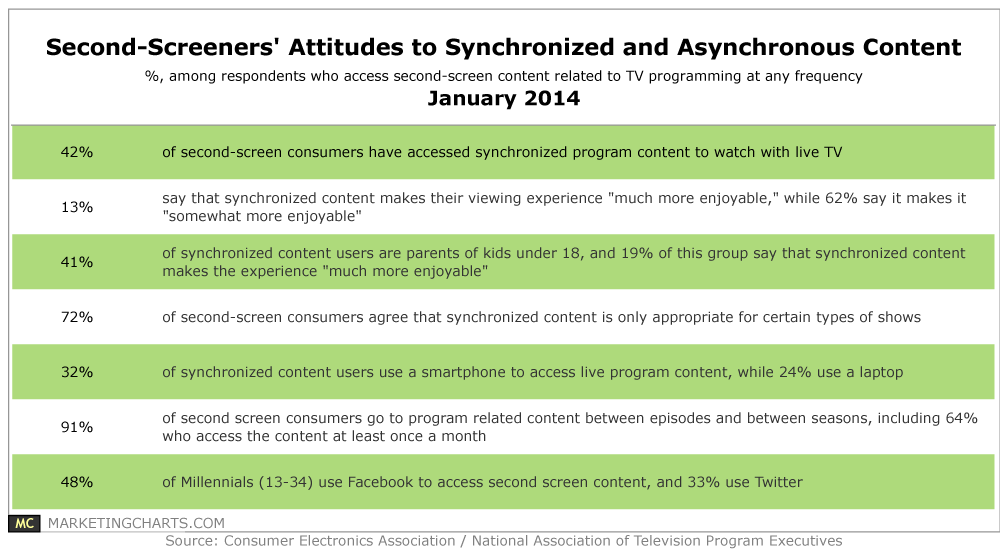
Second-Screeners' Attitudes Toward Synchronized & Asynchronous Content, January 2013 [TABLE]
Only 4 in 10 respondents reported trying synchronized program content to watch with live TV, and few found that it significantly enhanced their experience.
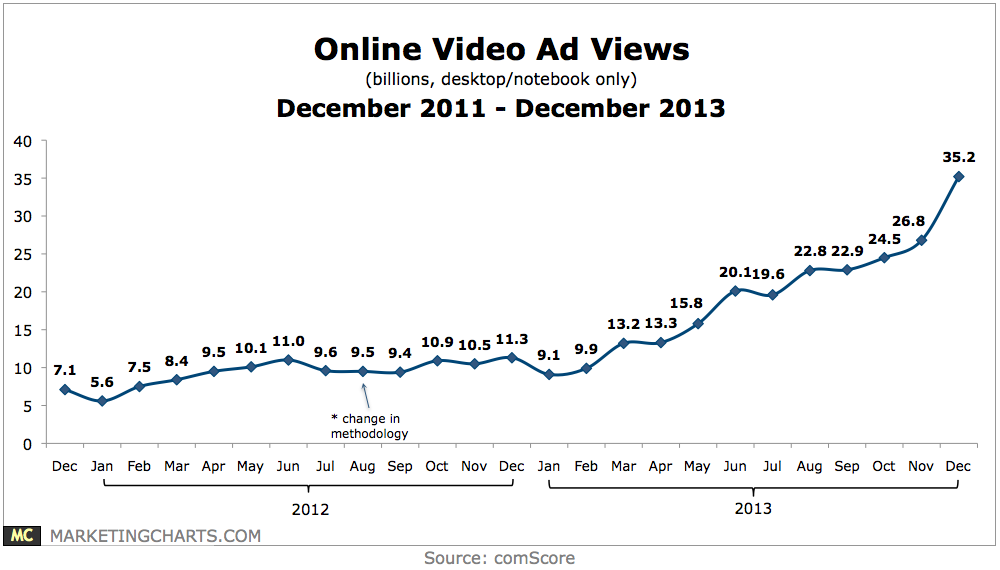
Read MoreOnline Video Ad Views, December 2011 – December 2013 [CHART]
Americans watched almost 52.4 billion online videos from desktops and notebooks in December 2013, surpassing the 50 billion mark for the first time on record.
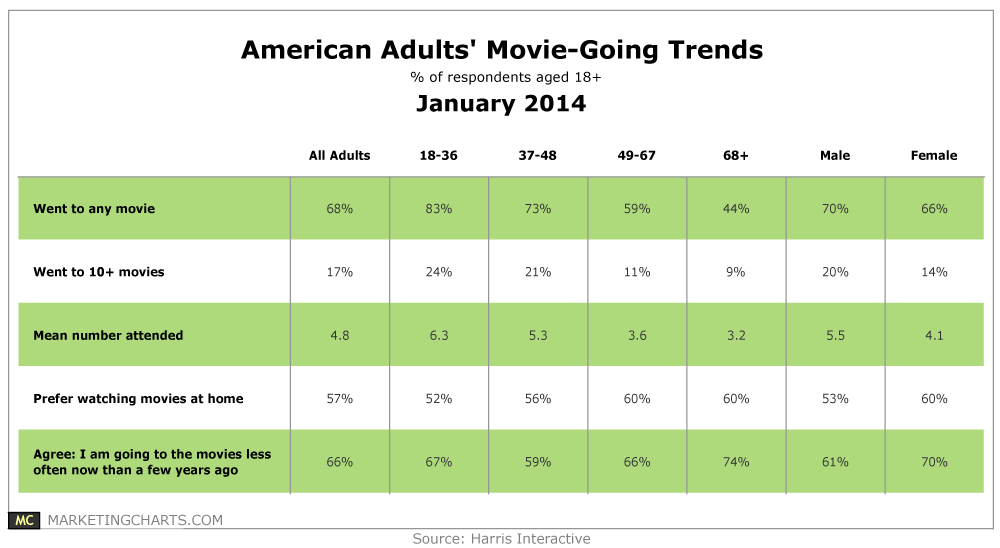
Read MoreAmericans' Movie-Going Frequency By Age, January 2014 [TABLE]
Americans went to about 5 movies on average last year.
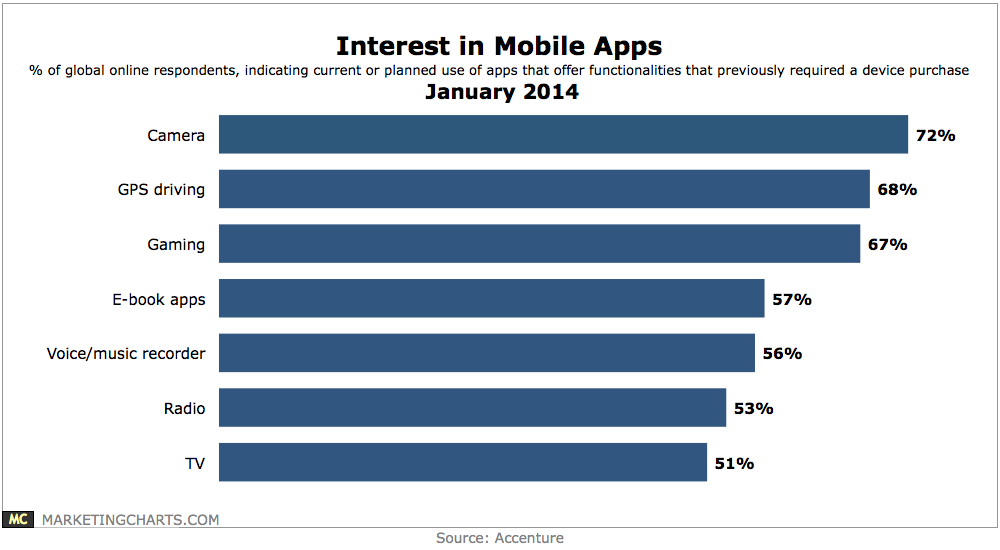
Read MoreInterest In Mobile Apps, January 2014 [CHART]
A sizable proportion of consumers from 6 major markets around the world are planning to buy smartphones (52%) and tablets (40%) over the next year.
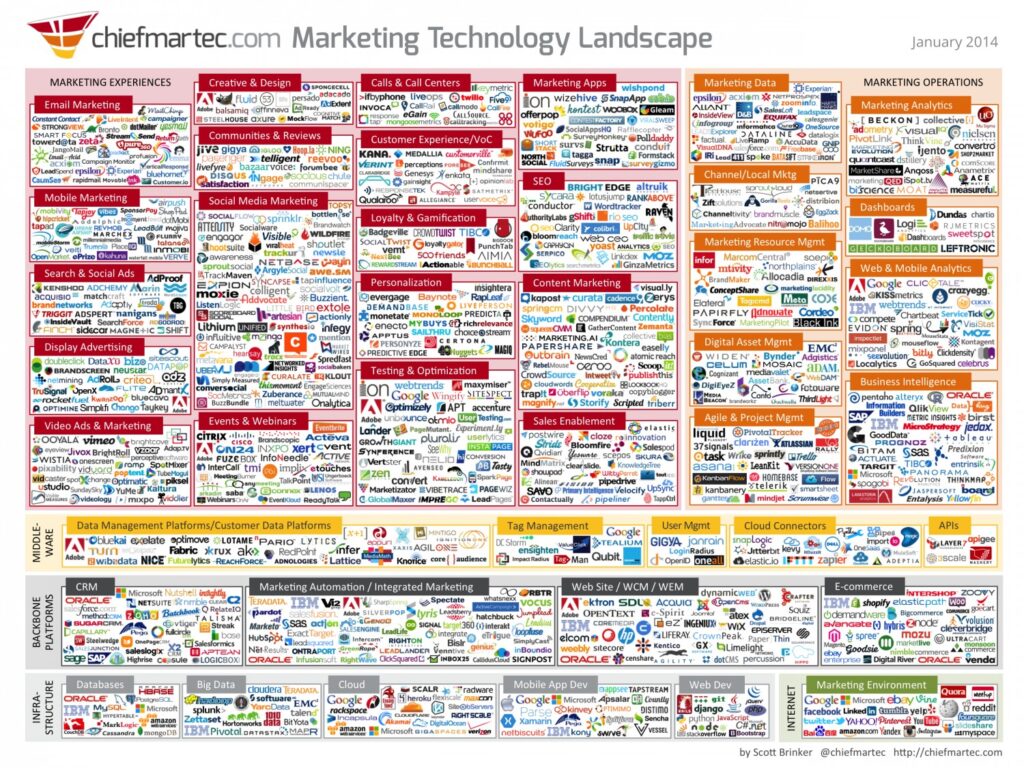
Read More2014 Marketing Technology Landscape [INFOGRAPHIC]
This infographic illustrates the marketing technology universe with 947 different companies that provide software for marketers.
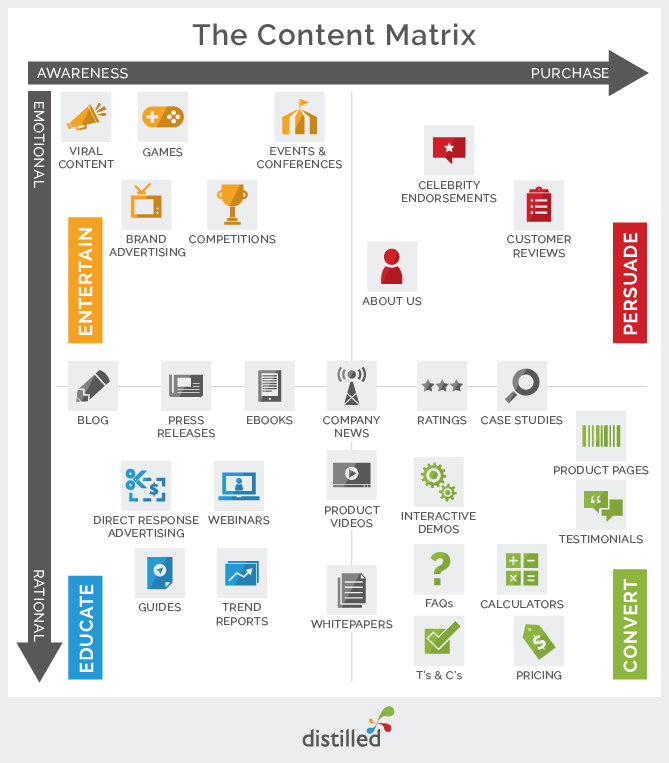
Read More4 Types Of Content For Marketing [CHART]
This superb chart by distilled breaks down content according to marketing goals, from awareness to purchase.
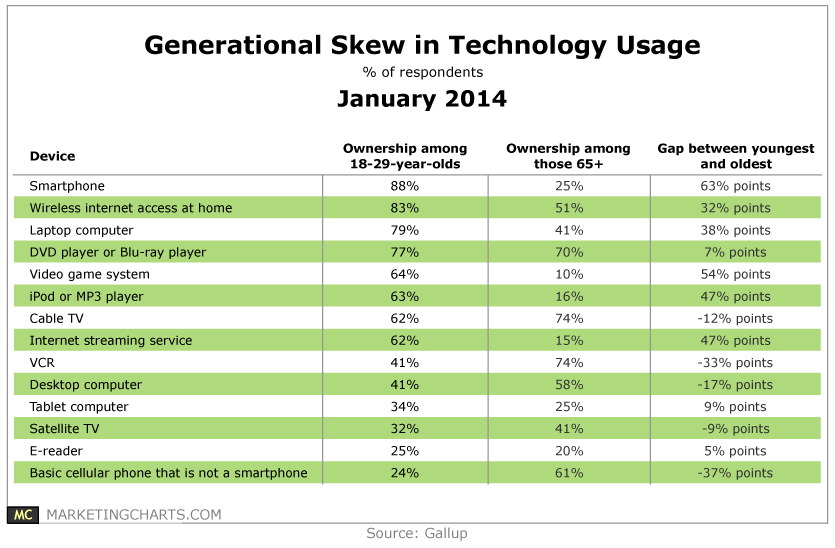
Read MoreTechnographic Generational Gap By Device, January 2014 [TABLE]
Gallup measured the penetration rates of 14 consumer electronic devices among 18-29-year-olds and those aged 65 and up.
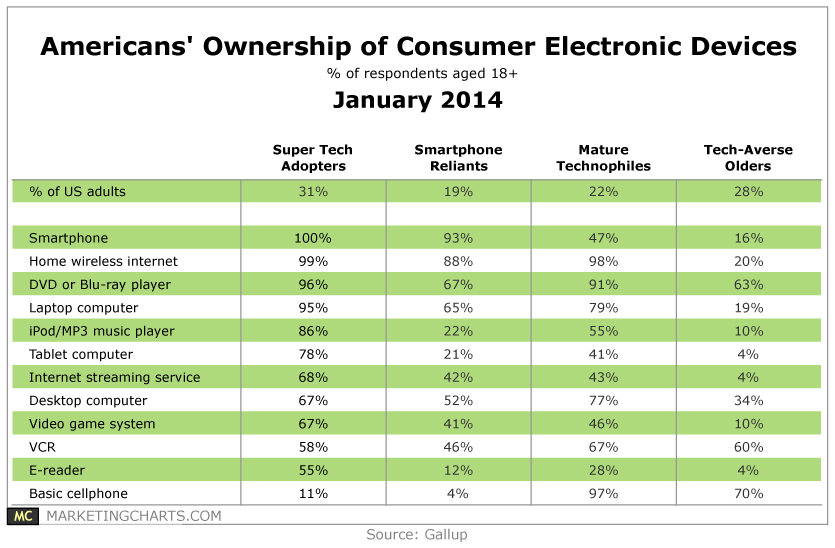
Read MoreConsumer Electronics Owned By Americans, January 2014 [TABLE]
Of the 12 consumer electronics devices identified, 9 see penetration rates of 67% or higher among Super Tech Adopters.
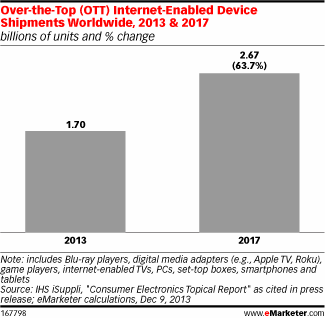
Read MoreGlobal Over-the-Top Online Enabled Device Shipments, 2013 & 2017 [CHART]
Shipments of over-the-top (OTT) devices reached an estimated 1.67 billion worldwide in 2013.
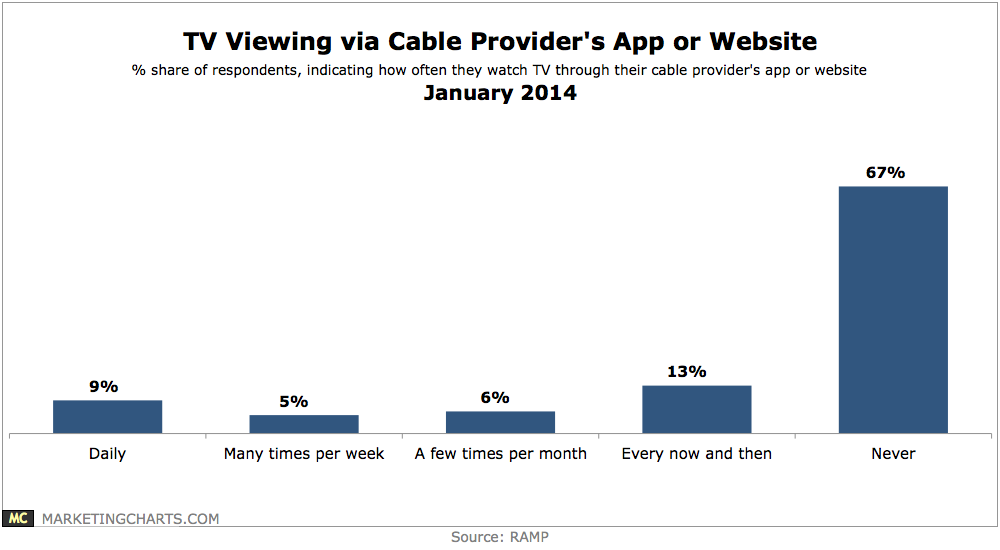
Read MoreTV Viewing Via Cable Provider's App Or Website, January 2014 [CHART]
Some 80% of respondents are unaware of TV Everywhere.
Read More