Video Marketing
Event Planning [INFOGRAPHIC]
This infographic from Château Le Jardin is chock full of marketing considerations every event planner will want to know.
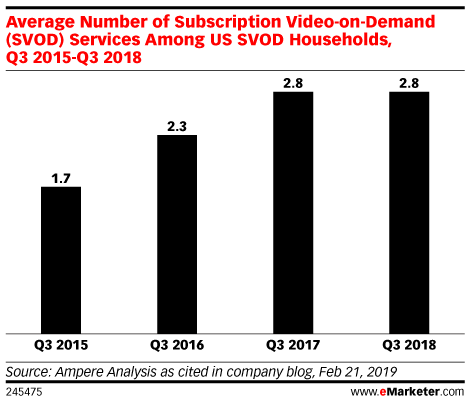
Read MoreAverage Household Streaming Video Subscriptions, 2015-2018 [CHART]
Many Americans believe they will use more subscription services in the future. But when it comes to video streaming, more options doesn’t mean consumers will drastically increase the number of services they’re willing to pay for.
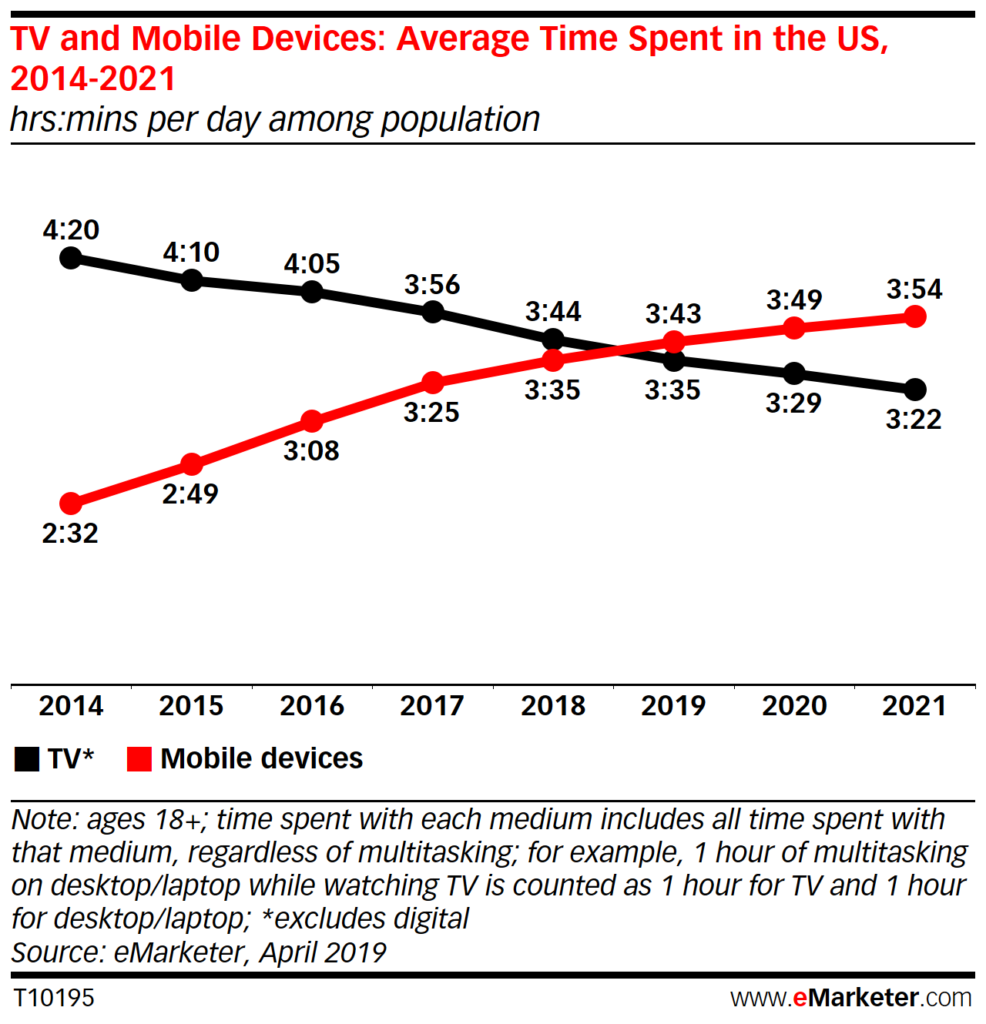
Read MoreAverage Time Spent On TV & Mobile Devices, 2014-2021 [CHART]
Consumers’ use of smartphones will continue to make up the majority of their media consumption, but that use will plateau by 2020, as consumers become increasingly uneasy about overuse of mobile devices.
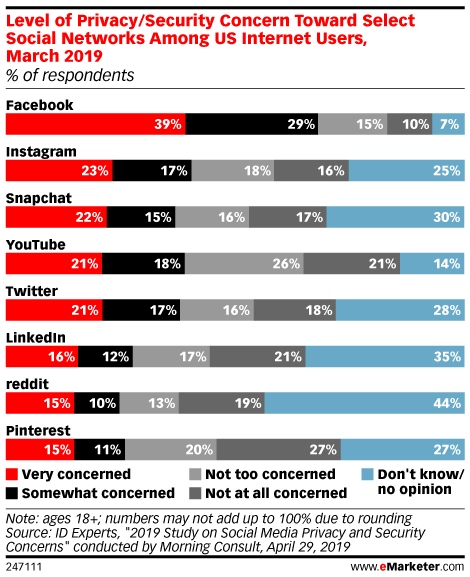
Read MorePrivacy Concerns By Social Network [CHART]
In a March 2019 survey conducted by Morning Consult on behalf of ID Experts, an identity protection services firm, 39% of US internet users said they were “very concerned” about privacy and security on Facebook, and 29% said they were “somewhat concerned.” “Advertisers should pay attention to the types of data that people will be…
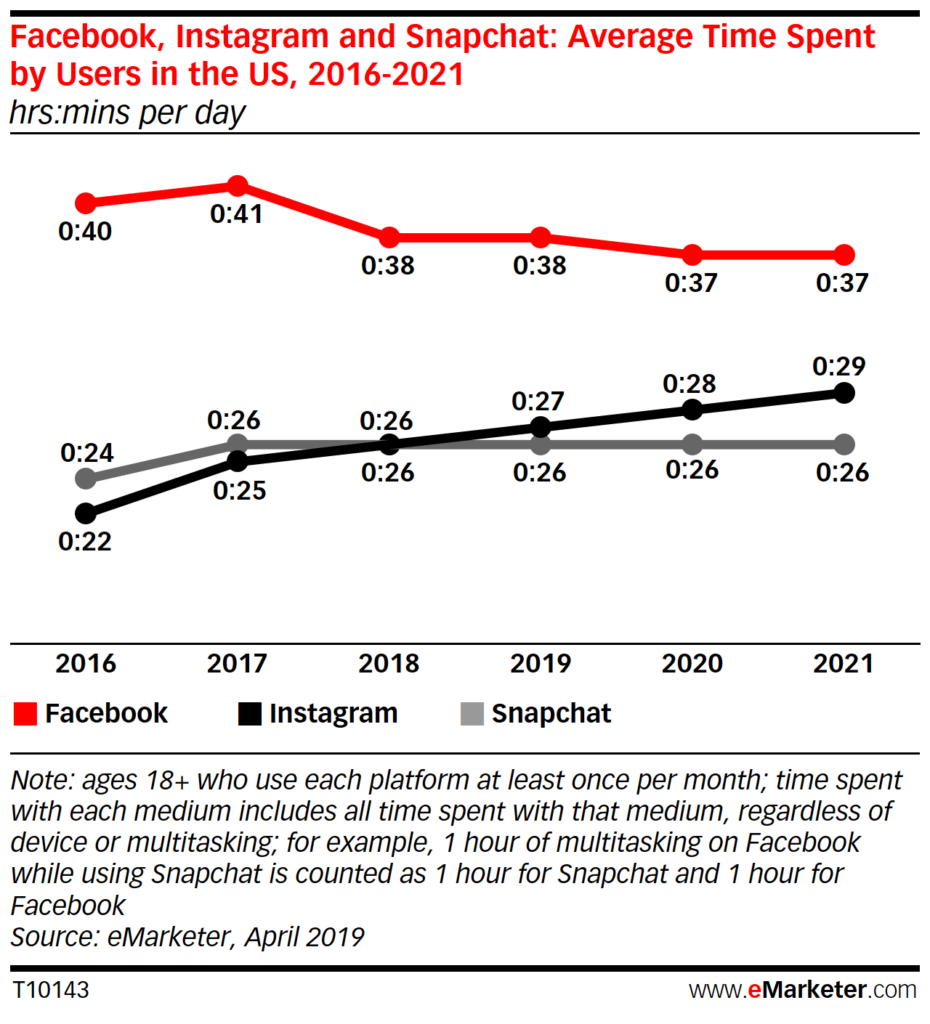
Read MoreTime Spent On Instagram, Facebook & Snapchat, 2016-2021 [CHART]
Facebook’s move last year to discourage passive consumption of content, especially videos, has impacted engagement. Average daily time spent on the platform by US adult users fell by 3 minutes in 2018.
Read More6 Types Of Digital Marketing For Business [INFOGRAPIC]
This infographic from Point Blank Digital illustrates six types of digital marketing tactics that are important to business success.
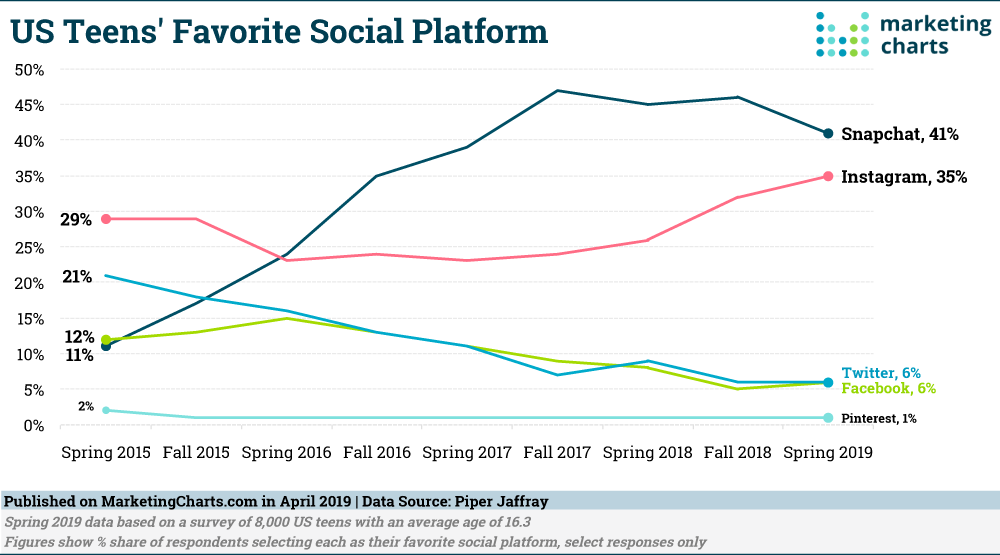
Read MoreTeens' Favorite Social Media Platforms, 2015-2019 [CHART]
Looking at the period between Spring 2015 and Fall of 2017, Snapchat seemed to be on an unstoppable rise in becoming the favorite social platform for the majority of teens.
Read MoreIGTV Marketing [INFOGRAPHIC]
This infographic from M2 OnHold illustrates how to use Instagram TV for marketing.
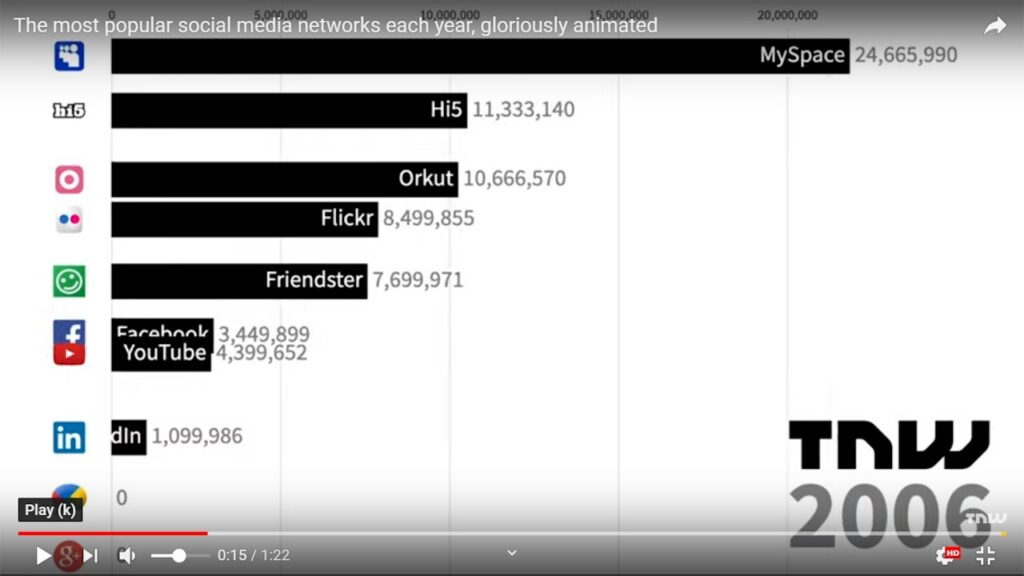
Read MoreSocial Network Dominance, 2003-2018 [ANIMATED GRAPHIC]
TheNextWeb created this amazing and mesmerizing animated graphic that illustrates the rise and fall of the most popular social media sites from 2003 to 2018 accompanied by monthly active user data at any point, so you can watch the rise and fall of Friendster and MySpace, for example.
Read MoreMarketing Skills To Master [INFOGRAPHIC]
This infographic from Maryville University illustrates eleven skills modern marketers must master.
Read More
