Video Marketing
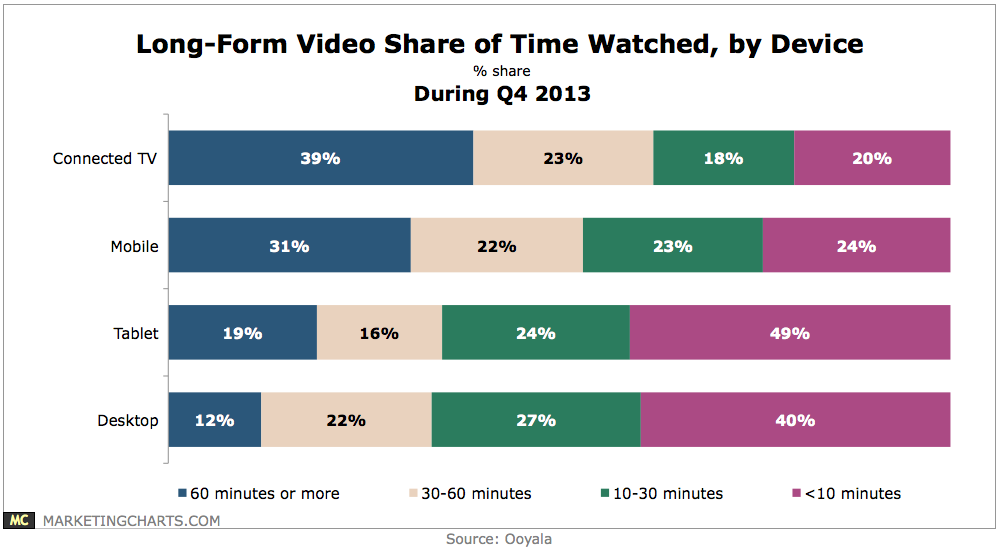
Long-Form Video Share Of Time Watched By Device, Q4 2013 [CHART]
The majority of mobile video viewing time in Q4 2013 was spent with content at least a half-hour in length.
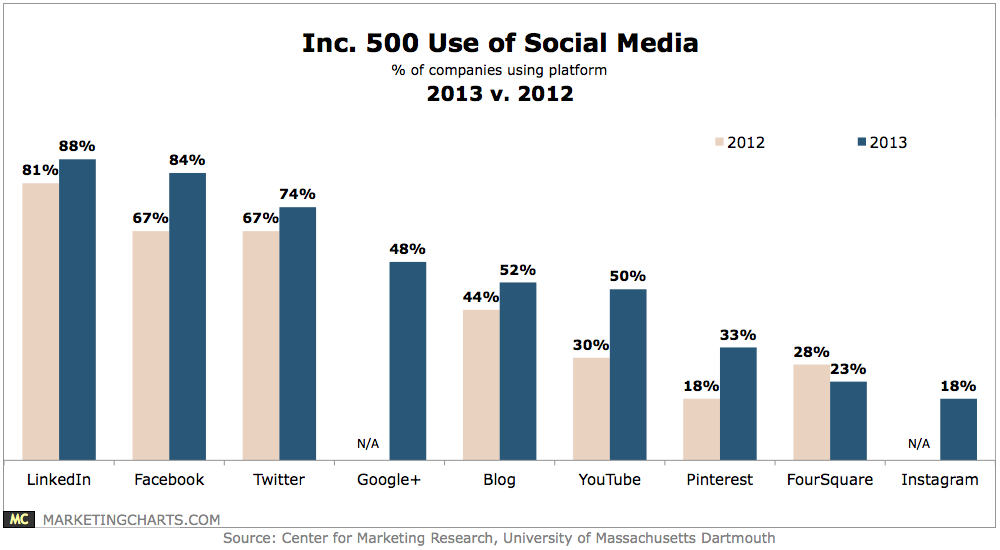
Read MoreInc. 500's Social Media Use, 2012 vs 2013 [CHART]
Virtually all – 95% – of the 2013 Inc. 500 companies are using at least one major social media tool.
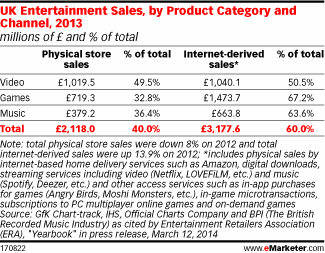
Read MoreUK Entertainment Sales By Category & Channel, 2013 [TABLE]
Internet-derived sales rose 13.9% year over year in 2013 to account for 60.0% of the UK entertainment retail market.
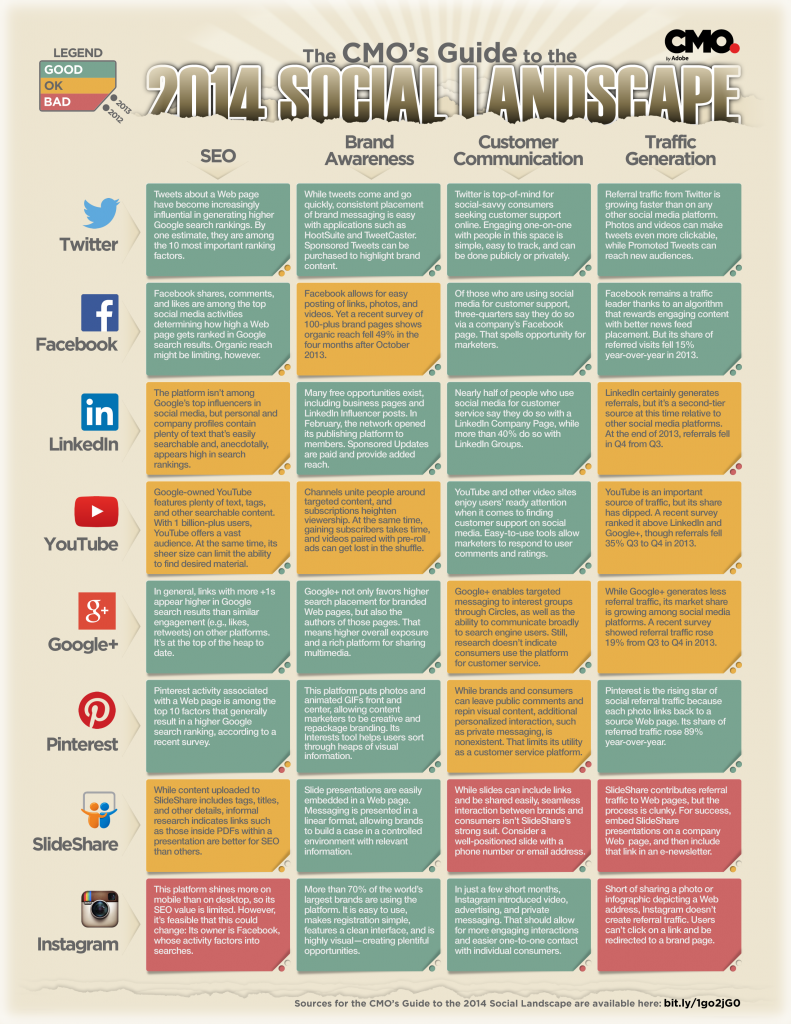
Read More2014 Social Landscape [INFOGRAPHIC]
Adobe’s CMO.com released their 5th annual CMO Guide to The Social Landscape highlighting the top 8 social networks for businesses.
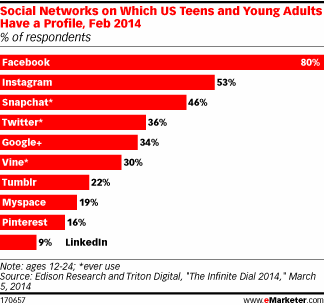
Read MoreTop Social Networks For Which Young Millennials Have A Profile, February 2014 [CHART]
Approximately 46% of US teens and young adults ages 12 to 24 had used Snapchat.
Read MoreThe Student Marketing Lifecycle [INFOGRAPHIC]
This infographic by Oho illustrates the stages of research a prospective student goes through when deciding which college to attend.
Read MoreFacebook's Oculus Rift Acquisition & Gwyneth Paltrow's Conscious Uncoupling Blog
David Erickson and B.L. Ochman discuss Caribou Coffee’s aggressive upselling; Gwyneth Paltrow’s Conscious Uncoupling & Facebook’s acquisition of Oculus Rift.
Read MoreMillennials' Adoption Of Streaming Video/TV Services, Q4 2012 vs Q4 2013 [CHART]
Younger Millennials (18-24) more likely than the older (25-34) cohort to subscribe to OTT services, with both groups increasing adoption year-over-year.
Read MoreMost Frequently Used Omnichannel Research Sources By Category, March 2014 [TABLE]
Study also finds that the path-to-purchase has shortened to a little more than 2 days, even for higher-ticket items.
Read MoreThe Plunging Value Of Television Advertising [CHART]
The number of households watching prime-time TV has clearly fallen, while ad rates per person have gone up.
Read More