Video Marketing
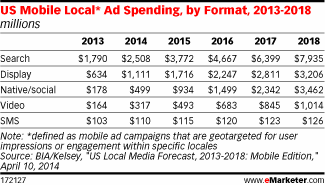
US Mobile Local Ad Spending By Format, 2013-2018 [TABLE]
Search and social were among the top among formats, with search claiming the majority of location-targeted mobile ad spending through 2018.
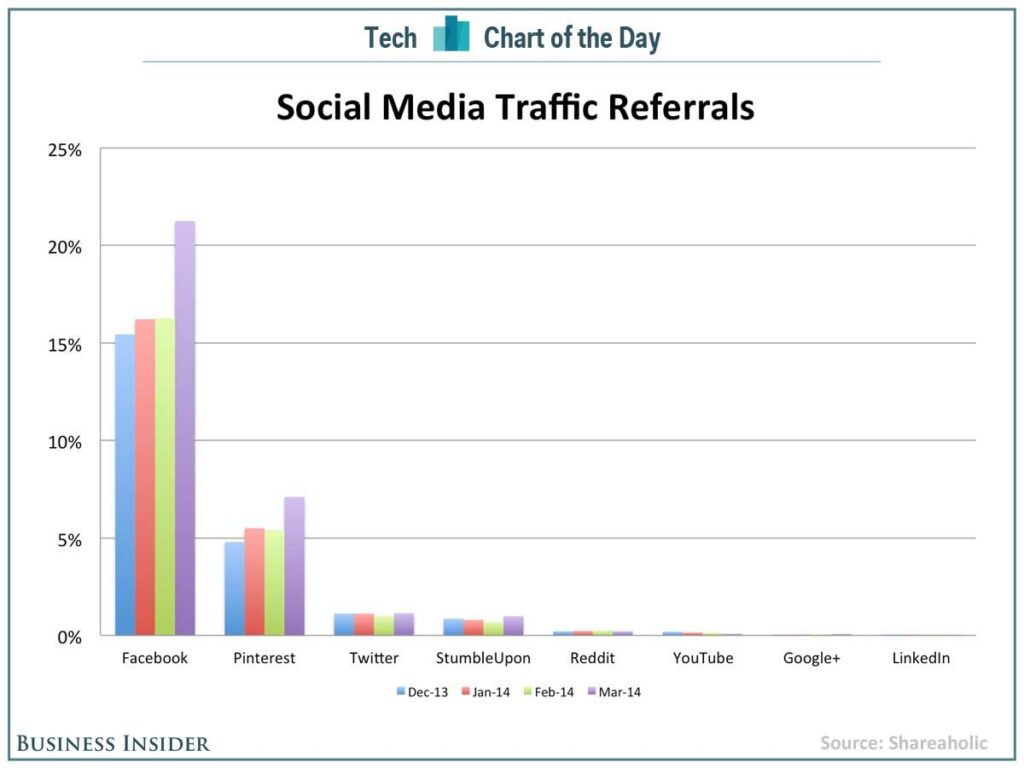
Read MoreSocial Media Traffic Referrals [CHART]
Pinterest is way more important than Twitter or Reddit for referral traffic.
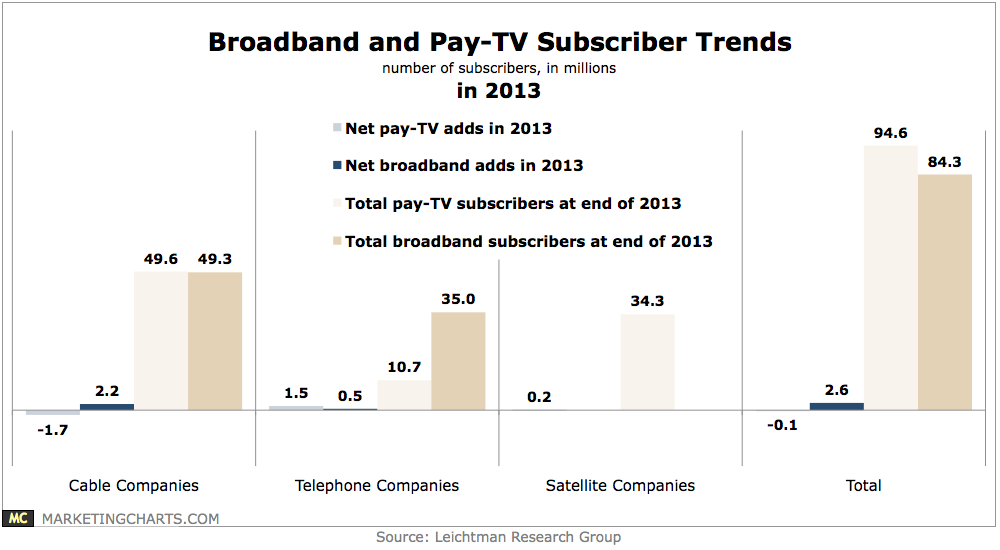
Read MoreBroadband & Pay-TV Subscribers In 2013 [CHART]
While the rate of cord-cutting slowed last year, cable companies shed almost 2 million pay-TV subscribers while adding more than 2 million broadband internet subscribers.
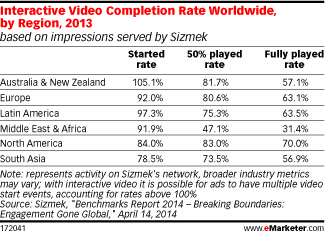
Read MoreInteractive Video Completion Rates Worldwide By Region, 2013 [TABLE]
While clickthrough rates for such ads in 2013 were much lower than those for HTML5 polite video and in-stream video, at 0.17%, 0.39% and 0.60%, respectively, interactive videos did just what they set out to do: Engage those who did view them.
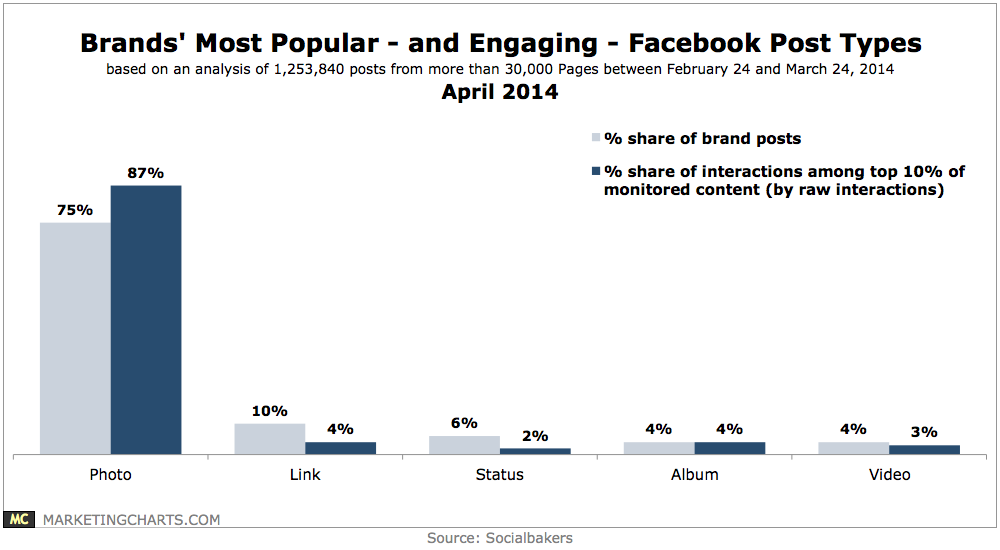
Read MoreBrands’ Most Engaging & Popular Facebook Post Types, April 2014 [CHART]
Three-quarters of the more than 1 million brand posts monitored by Socialbakers between February 24 and March 24 were photos, with links (10%), status posts (6%) and videos (4%) less common.
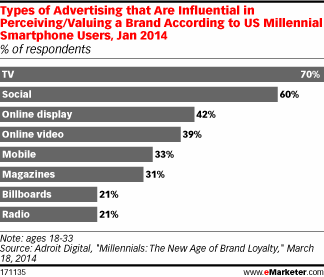
Read MoreTypes Of Advertising That Influence Brand Value Among Mobile Millennials, January 2014 [CHART]
18- to 34-year-olds were far more likely to ignore online ads, such as banners and those on social media and search engines, than they were traditional TV, radio and newspaper ads.
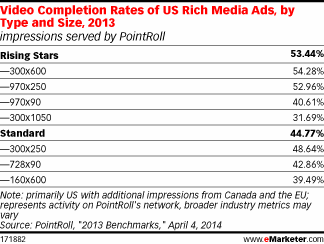
Read MoreVideo Completion Rates Of Rich Media Ads By Type & Size, 2013 [TABLE]
Clickthrough rates for rising stars were 70% higher than for standard placements, and video completion rates experienced a 19% lift.
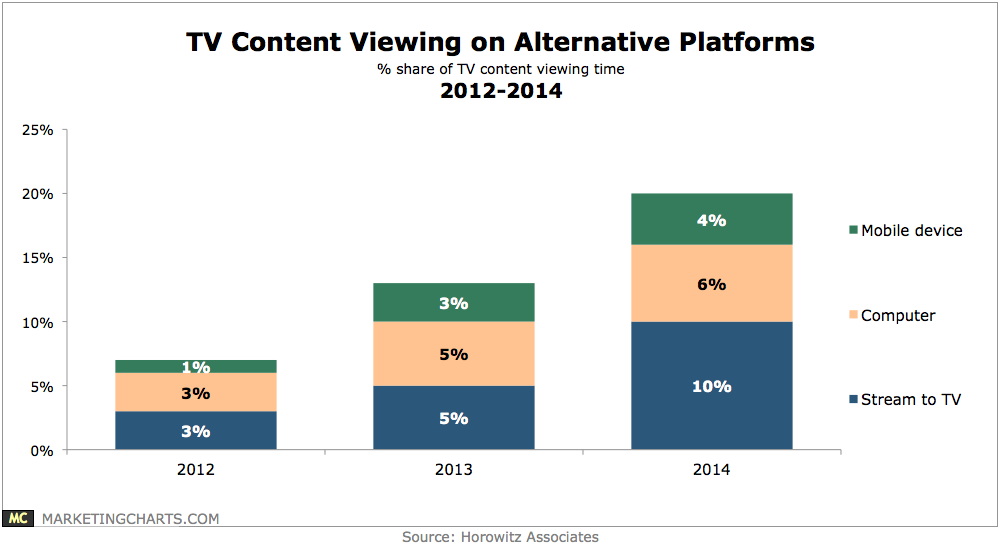
Read MoreTV Viewing On Alternative Devices, 2012-2014 [CHART]
The 20% of TV content viewing time spent on alternative platforms is a significant step up from 13% last year, with the biggest change being for streaming to the TV set (10% this year, up from 5%).
Read MoreGrowth In TV-Related Queries On Google & YouTube, 2012 vs 2013 [CHART]
TV-related searches on YouTube were up 54% during May-December 2013 over the comparable year-earlier period.
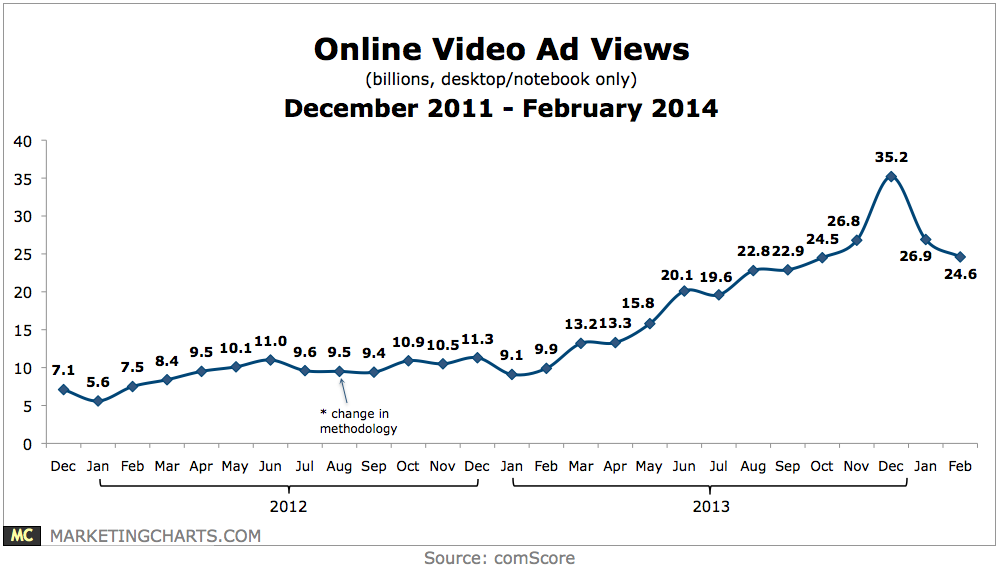
Read MoreOnline Video Ad Views, December 2011 – February 2014 [CHART]
Despite online video ad views (desktop/notebook only) falling during the first couple of months of the year, the February total (24.6 billion) remains significantly above the year-earlier period (9.9 billion).
Read More