Video Marketing
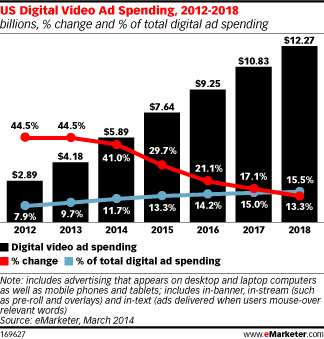
US Online Video Ad Spending, 2012-2018 [CHART]
Online video advertising will make up nearly 12% of all digital ad spending in the US this year.
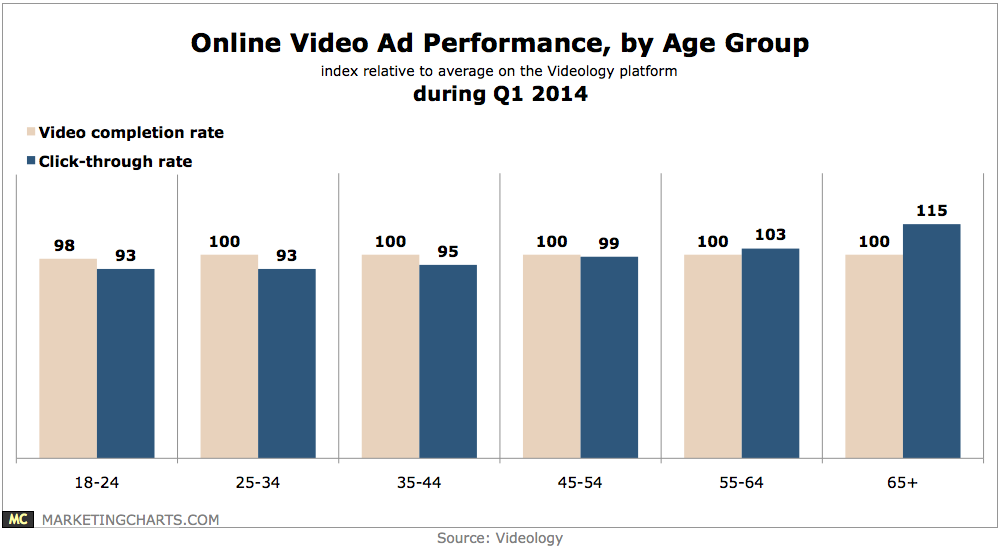
Read MoreOnline Video Ad Performance By Age, Q1 2014 [CHART]
Older viewers were more likely to click on video ads than their younger counterparts in Q1.
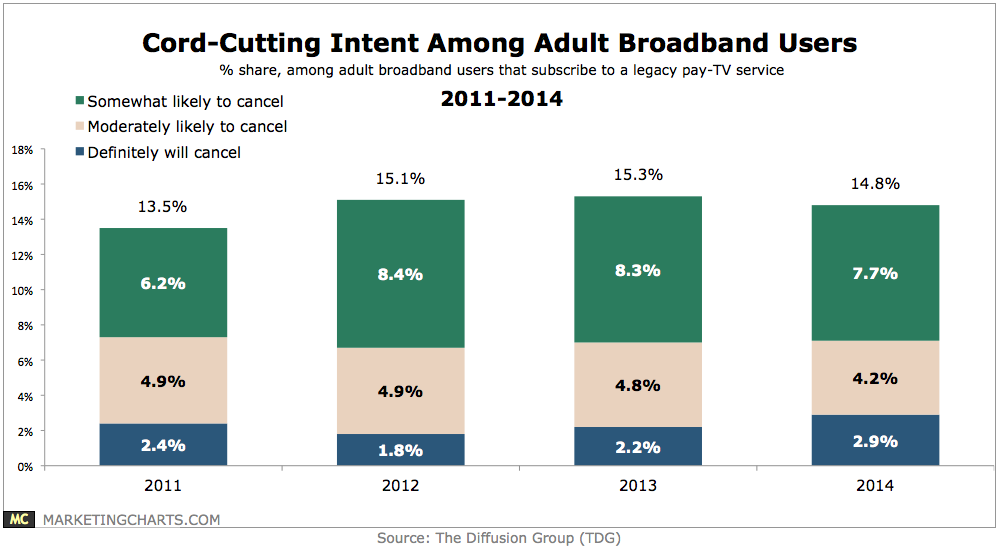
Read MoreCord-Cutting Intent Among Adult Broadband Users, 2011-2014 [CHART]
Customer satisfaction with pay-TV providers is at a multi-year low, but that doesn’t appear to be affecting subscriptions.
Read MoreSocial Channels Top Charities & Non-Profits Use, June 2014 [CHART]
Social media use is almost ubiquitous among top charities and non-profits, with 98% using at least one platform.
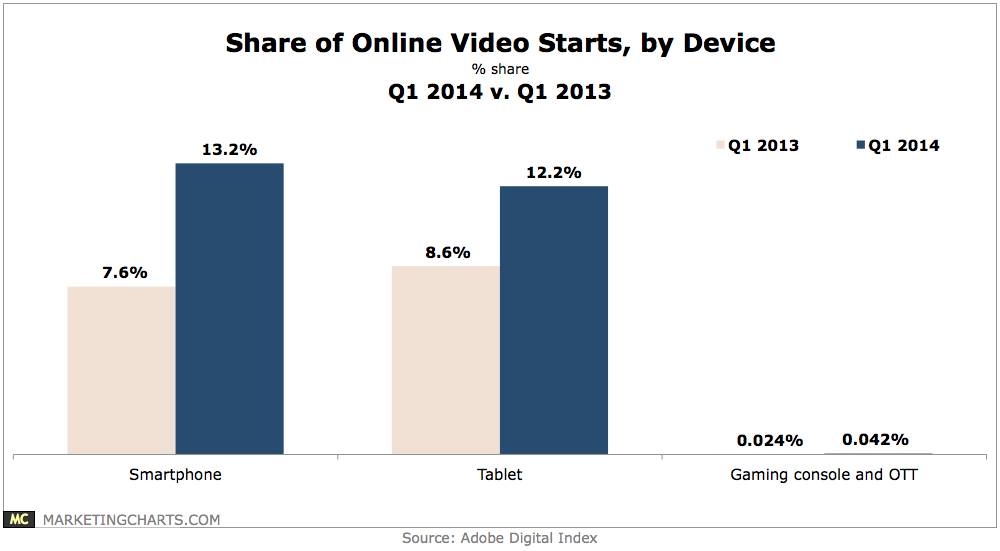
Read MoreShare Of Online Video Starts By Device, Q1 2013 vs Q1 2014 [CHART]
Smartphones (13.2%) and tablets (12.2%) combined to account for one-quarter of digital video starts in Q1, up from 16.2% a year earlier.
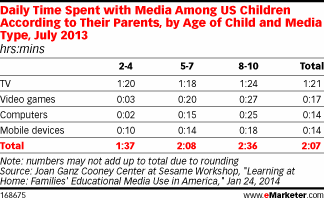
Read MoreGeneration V Media Consumption By Age & Channel, July 2013 [TABLE]
TV remains the biggest single element of Generation V’s media usage.
Read MoreMeetings [INFOGRAPHIC]
This infographic from Fuze illustrates some surprising facts about meetings.
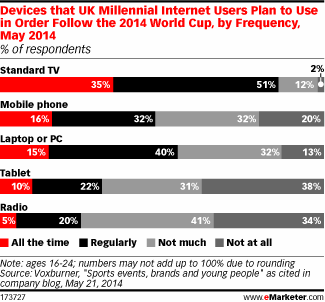
Read MoreDevices UK Millennials Will Use To Follow The World Cup, May 2014 [CHART]
TV will be the medium of choice for UK consumers following the action, even among the most digitally connected and especially mobile millennial cohort.
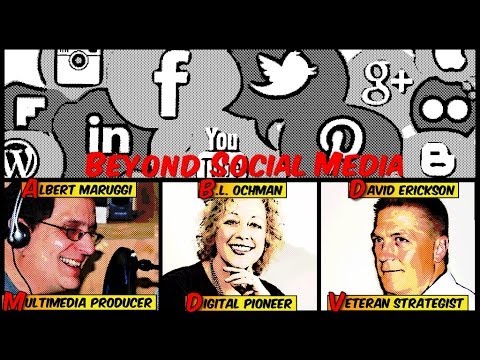
Read MoreGoPro Shark Attack & Twitter Relationship Surveys [VIDEO]
Episode 52 of the Beyond Social Media show: David Erickson & BL Ochman discuss the GoPro Shark Attack video as a marketing gimmick & Twitter’s social graph.
Read MoreThe Mobile Consumer [INFOGRAPHIC]
This infographic from vouchercloud illustrates the many facets of the mobile consumer.
Read More