Video Marketing
US Online Video Ad Spending Forecast, Desktop vs Mobile, 2014-2018 [CHART]
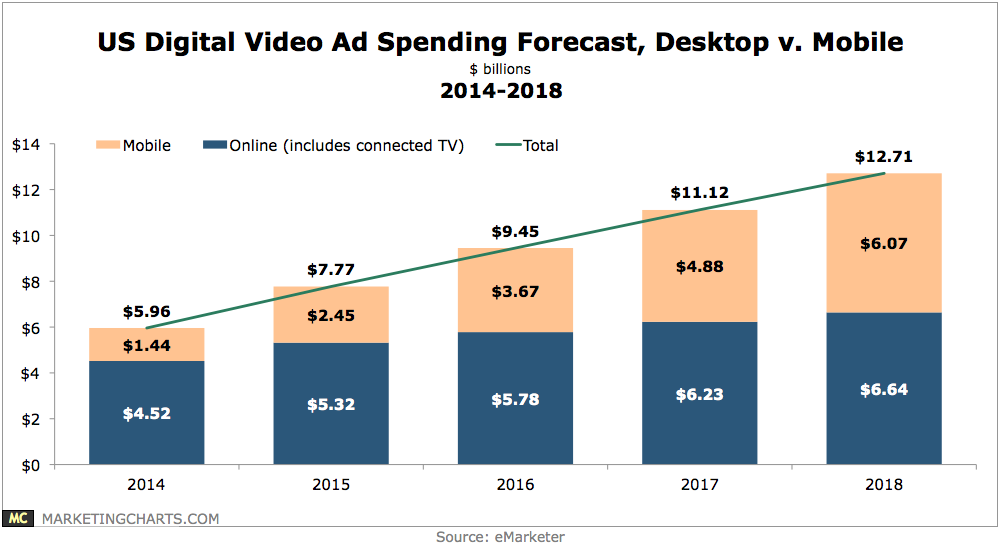
Marketers will spend more than $1.4 billion on mobile video ads this year, or close to one-quarter of total digital video ad spending.
Read MoreFrench 2014 World Cup Watchers By Device [CHART]
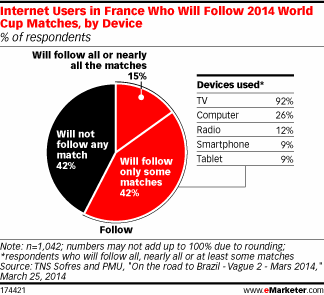
Out of the 57% of internet users in France who said they would follow at least some of the tournament’s games, just 9% planned to use a smartphone to do so.
Read MoreLikelihood Pay TV Subscribers Will Cut The Cord, 2011-2014 [TABLE]
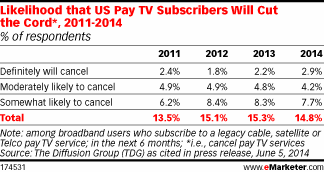
The percentage of pay TV subscribers who were likely to cancel their cable services had held steady between 2011 and 2014.
Read MoreReasons People Watch TV Everywhere, November 2013 [CHART]
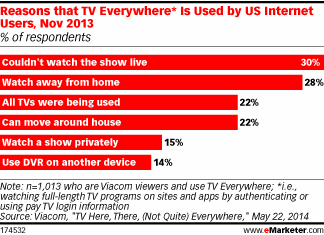
Flexibility is the main reason today’s busy, on-the-go consumers are taking advantage of TV Everywhere.
Read MoreMonthly TV Everywhere Videos Viewed By Device, Q1 2013 & Q1 2014 [CHART]
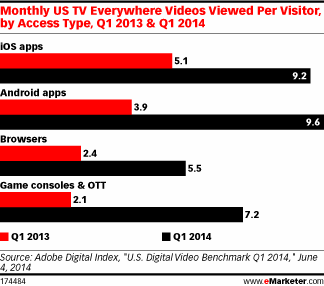
The number of unique TV Everywhere visitors in the US rose 157% between Q1 2013 and Q1 2014 and 49% between Q4 2013 and Q1 2014.
Read MoreTide Culturejacks Game Of Thrones & Google+ Thumbnails Are Going Away [VIDEO]

Episode 54 of the Beyond Social Media show: David Erickson & BL Ochman discuss Tide’s culturejacking of Game of Thrones and Google+’s vanishing thumbnails.
Read MoreUS Smart TV Users vs Dumb TV Users, 2012-2018 [CHART]
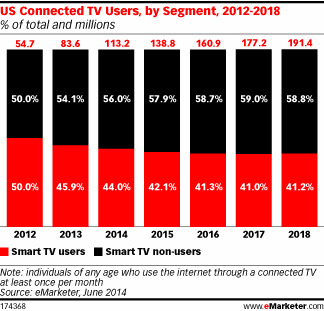
The share of smart TV users as a percentage of connected TV users will decrease slightly between 2014 and 2018, while the portion of smart TV non-users will rise.
Read MoreUS Smart TV Users, 2012-2018 [CHART]
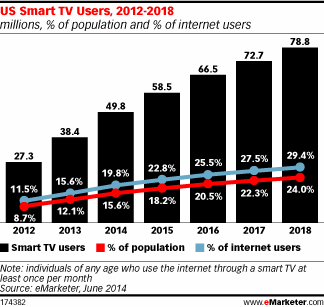
eMarketer forecasts that the number of US smart TV users will reach 49.8 million in 2014, or 15.6% of the population and 19.8% of internet users.
Read MoreUS Connected TV Users, 2012-2018 [CHART]
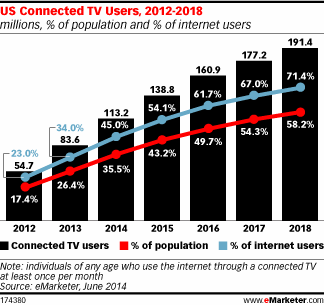
eMarketer estimates that more than 113 million people—35.5% of the US population and 45.0% of internet users—will use a connected TV regularly this year.
Read MoreOnline Ad Impressions & Actions, Q1 2014 [CHART]
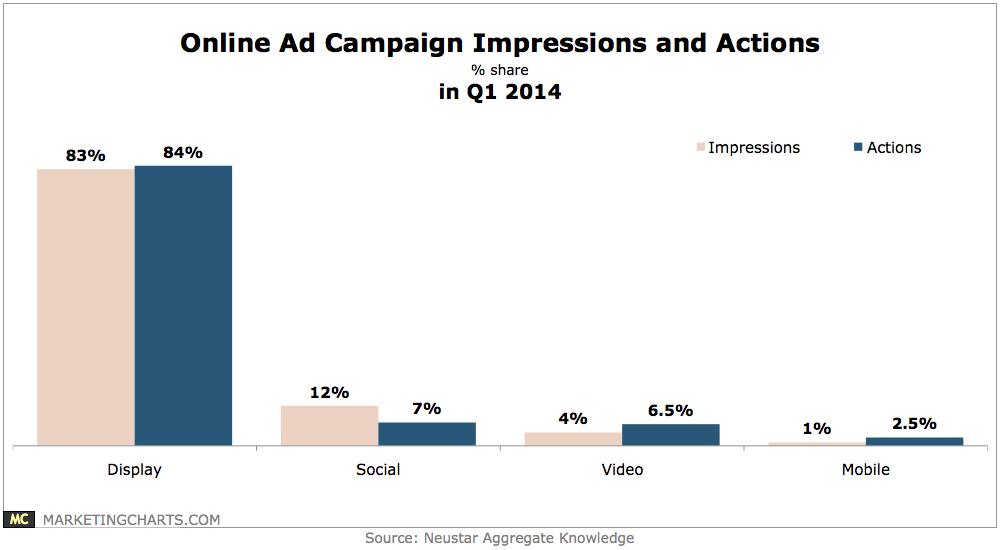
The vast majority of digital marketing spend across display, social, video and mobile was allocated to display ads (83%), which delivered 84% share of actions.
Read More