Video Marketing
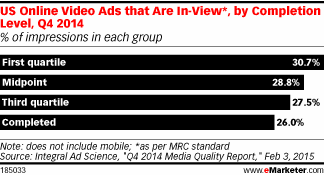
In-View Online Video Ad Views By Completion Level, Q4 2014 [CHART]
As viewability rates experienced a strong increase in Q4 2014, US video ad completion rates while in-view did, too, rising 6 percentage points from Q3 2014 to 26.0%.
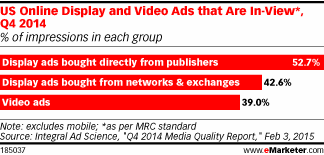
Read MoreIn-View Online Display & Video Ads, Q4 2014 [CHART]
The percentage of US online video ads that were in-view that quarter reached 39.0%, a 9-percentage-point quarter-over-quarter increase.
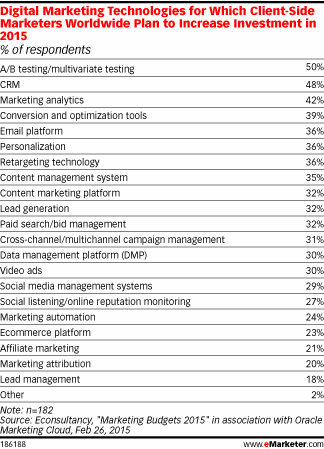
Read MorePlanned Increased Spending On Marketing Technologies In 2015 [TABLE]
Nearly eight in 10 client-side marketers said they would increase digital marketing technology spending in 2015, vs. 70% in 2014.
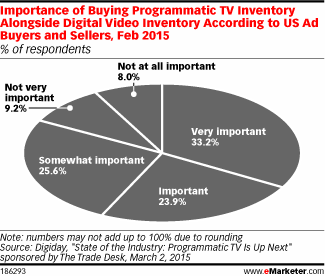
Read MoreImportance Of Buying Programmatic TV Ads & Video Ads, February 2015 [CHART]
67.1% purchased video programmatically, vs. 23.5% who said the same about TV.
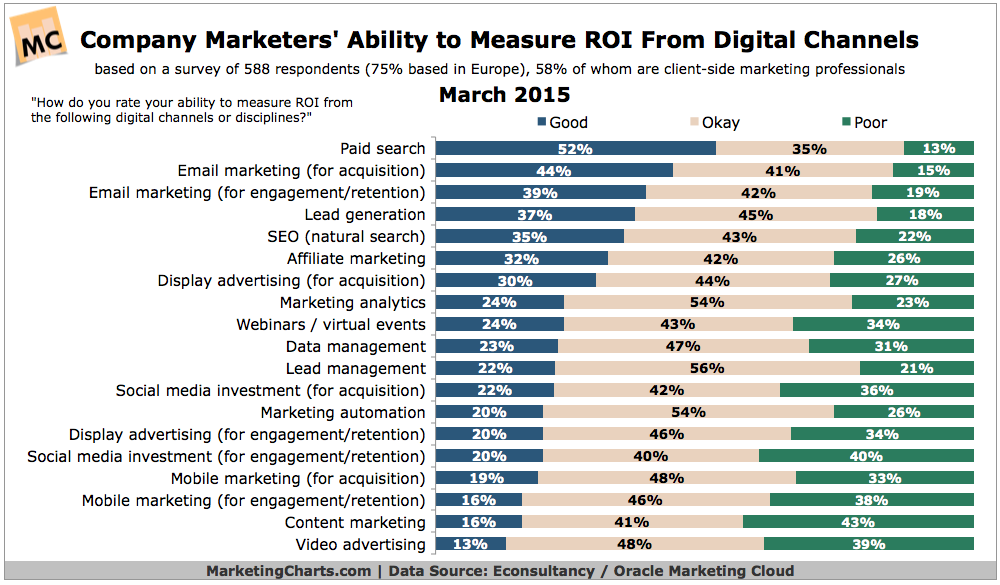
Read MoreMarketers' Ability To Measure ROI Of Online Marketing, March 2015 [CHART]
Despite increasing pressures to prove their worth, American CMOs continue to have difficulty quantitatively demonstrating the impact of their activities.
Read MoreHow Adoption Of HBO Go-Like Services Affects Cable Choices, November 2014 [CHART]
Viewers showed high interest in subscribing to premium channels online without having a pay TV subscription.
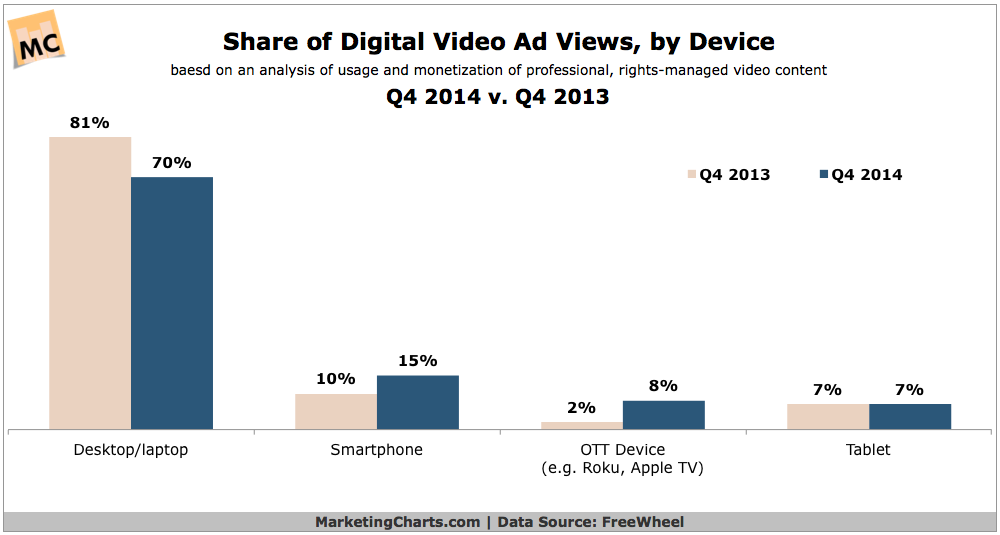
Read MoreShare Of Video Ad Views By Device, 2013 vs 2014 [CHART]
Tablets are popular devices for video viewing but OTT streaming devices such as Apple TV and Chromecast have moved ahead in digital video monetization.
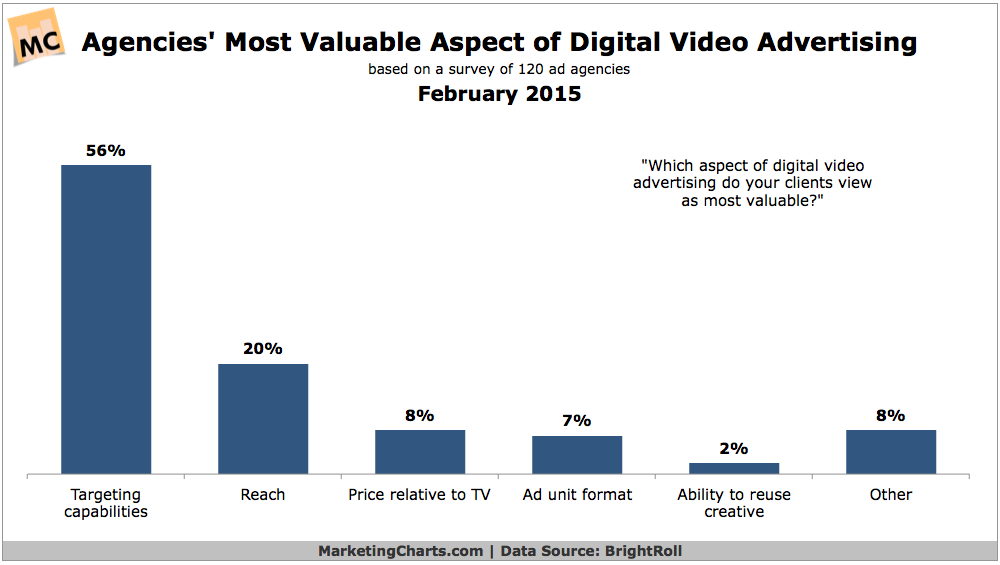
Read MoreMost Valuable Aspects Of Video Advertising For Agencies, February 2015 [CHART]
More than 7 in 10 agencies believe that online video advertising is either as effective or more effective than TV.
Read MoreThe Twitter/Google Deal
The Twitter & Google deal will present opportunities & some challenges for marketers and public relations professionals.
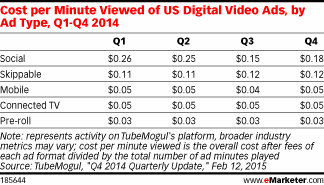
Read MoreCost Per Minute Viewed Of Video Ads, 2014 [TABLE]
The average weekly cost per minute viewed for pre-roll ads was 3.2 cents in Q4 2014—the lowest price.
Read More