Video Marketing
Social TV Engagement Rates By Show Type, May 2015 [CHART]
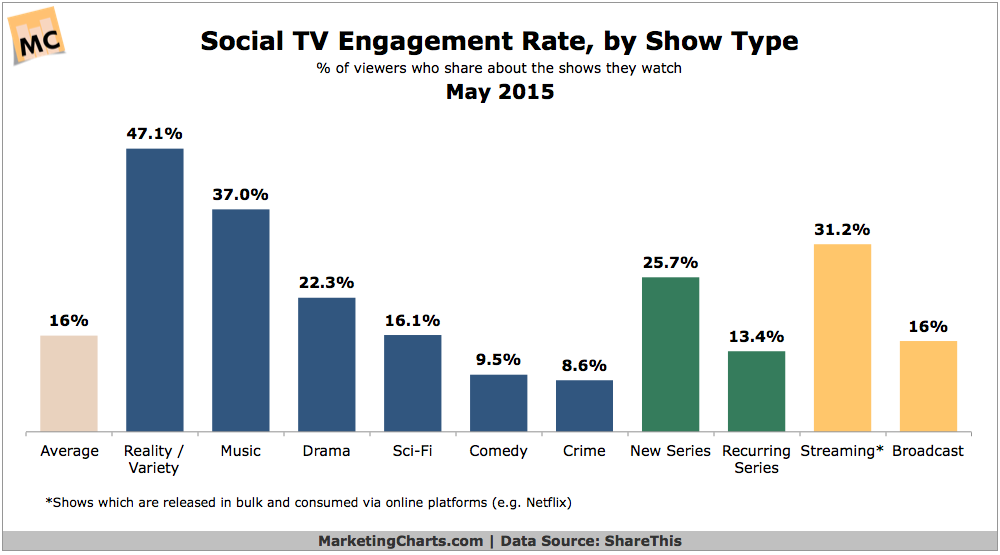
Some 16% of TV viewers on average share content about the shows they’re watching online, with these viewers driving an impressive 11% of all online sharing.
Read MoreThe Evolution Of Attention Metrics

Amazon Kindle’s new per-page read royalties are simply another hybrid on the evolutionary tree of attention metrics.
Read MoreDaily Time Spent With Video By Device, 2011-2015 [CHART]
Adults in the US will spend an average of 5 hours, 31 minutes watching video each day this year.
Read MoreSources For Local Business Information [CHART]
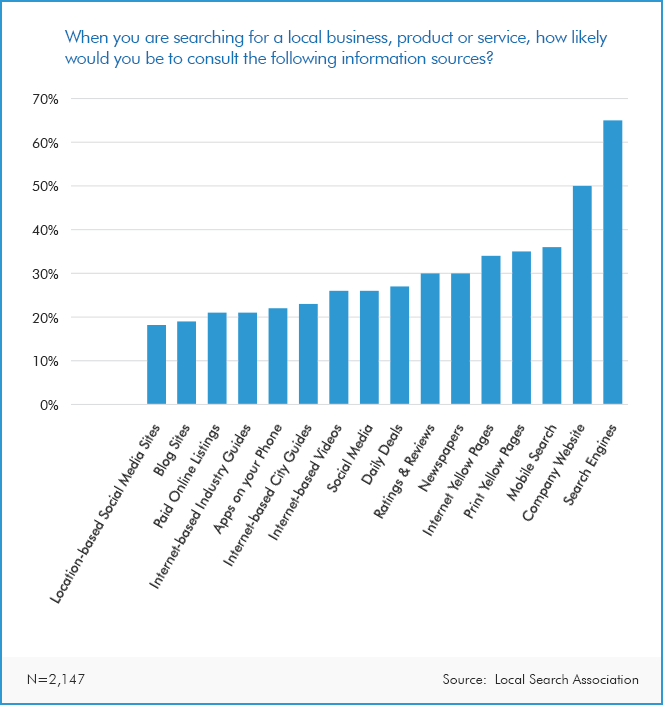
While search engines are leaders in the way that consumers look for local businesses and services, other media platforms and competition cannot be ignored.
Read MoreFacebook Organic Reach [INFOGRAPHIC]
This infographic by Quicksprout illustrates ways you can improve your content’s organic reach in Facebook.
Read MoreContent Buyers Consider Valuable Enough To Submit A Form, April 2015 [CHART]
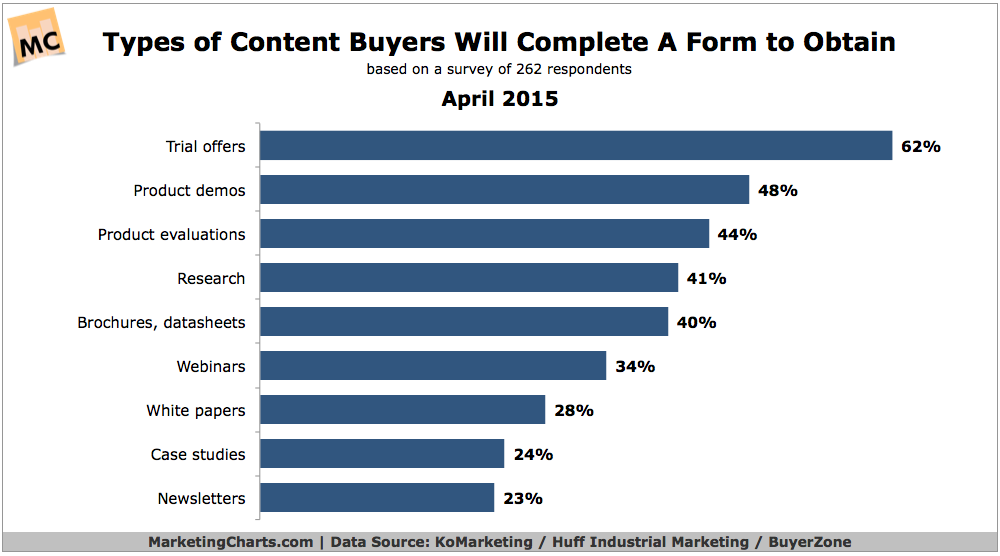
B2B vendor websites are often lacking the content elements buyers perceive as being most important.
Read MoreStreaming Video Ad Completion Rates By Device Type, 2014 [CHART]
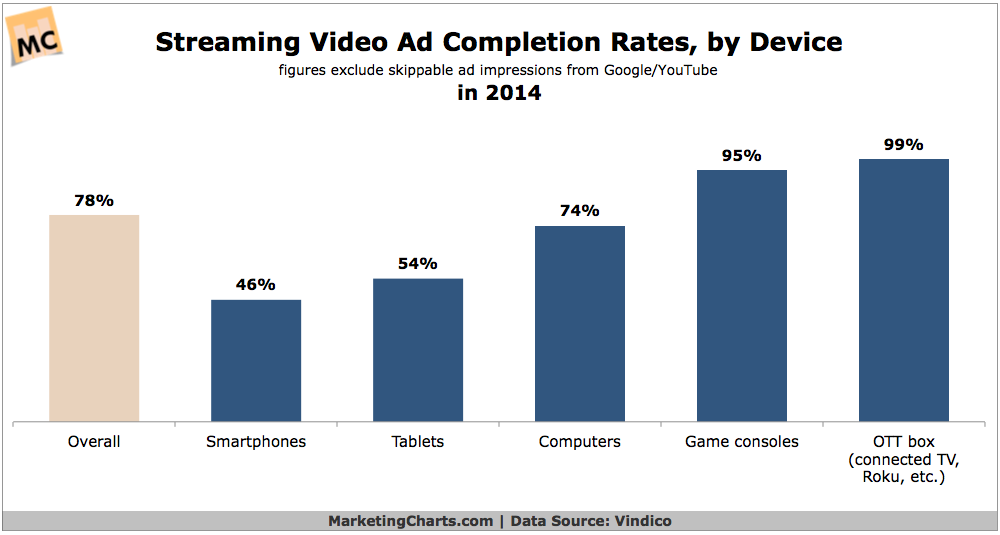
Streaming video ad completion rates were lower on devices with smaller screens last year.
Read MoreTop Product Launch Go-to-Market Strategies, April 2015 [CHART]
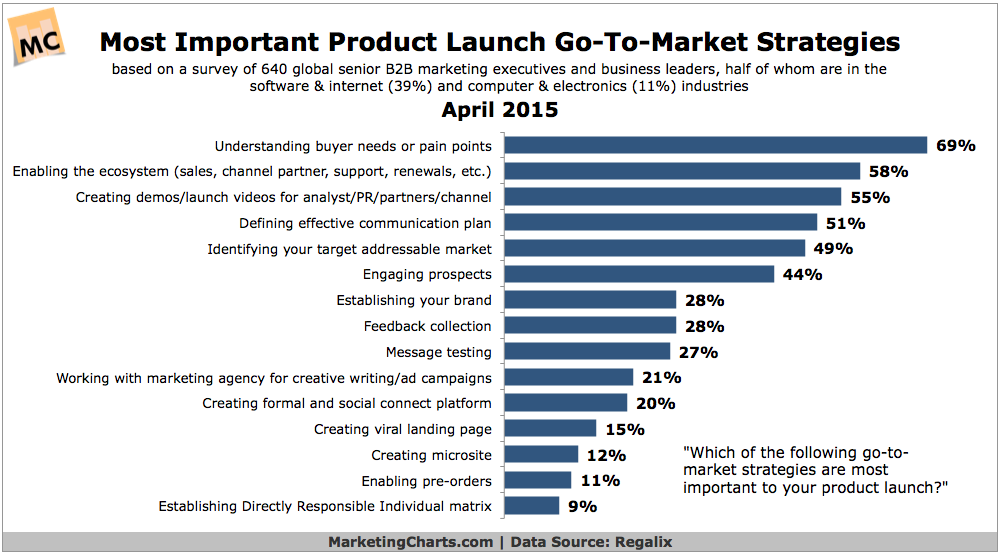
Understanding buyer needs or pain points counts as the most important go-to-market strategy for a product launch.
Read MoreHow Millennials Find Online Videos, February 2015 [CHART]
Millennials don’t find videos; videos find them.
Read MoreSocial Network Usage Share By Site & Age, December 2014 [CHART]
This year, 95.0% of 18-to-24-year-old internet users in the US will log on to a social network via any device at least once per month.
Read More