Video Marketing
Most Socially-Engaging TV Genres, January-November 2012 [CHART]

Sports (31%) and reality (17%) are the primary genres generating social TV buzz, combining to account for about half of social TV conversations.
Read MoreTop 10 Search Terms & Most Visited Sites Of 2012 [TABLE]
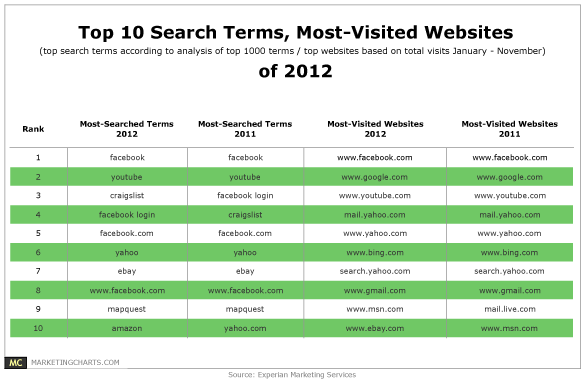
“Facebook” was the top search term in the US this year, accounting for 4.1% of all searches, representing a 33% increase from 2011.
Read MoreB2B Marketing Measurement [INFOGRAPHIC]

This infographic by eloqua takes a look at the state of B2B marketing measurement.
Read MoreExpected Change In Connected TV Viewing Behavior By Device, November 2012 [CHART]
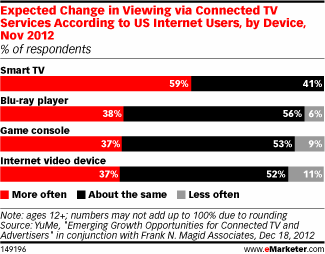
A nearly equal percentage of respondents expected to increase their connected TV viewing on consoles, Blu-ray players and internet video devices.
Read MoreInterest In Connecting TVs To The Internet By Device, November 2012 [CHART]
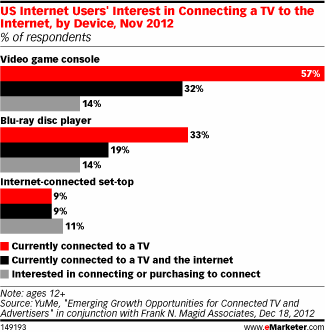
TVs connected to the internet either directly or through an external device are expected to reach 42% of US households by the end of next year.
Read MoreSocial Media For Nonprofits [INFOGRAPHIC]
This infographic by Infographic Labs takes a look at how nonprofits use social media.
Read MoreGlobal Mobile Ad Prompts, Q3 2012 [CHART]
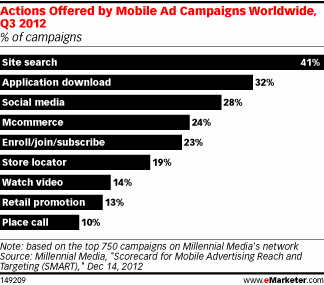
Advertisers were most interested in using mobile ads to lead viewers to site searches; this action was utilized by 41% of campaigns.
Read MoreWeb Series Costs [INFOGRAPHIC]

This infographic by The Danger Brain breaks down the costs of producing a web series using Video Game High School as an example.
Read MoreTime Spent Online By Activity & Device, 2012 [CHART]
Social media captures 31% of smartphone internet time, compared to 18% of PC internet time.
Read More