Video Marketing
Getting Facebook Shares [INFOGRAPHIC]
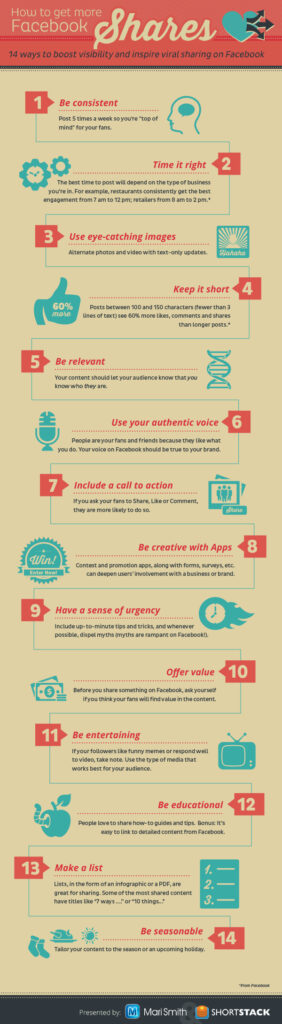
This infographic by Mari Smith illustrates fourteen tactics to inspire people to share your content on Facebook.
Read MoreSMB Marketing Budgets & Confidence In Competence, February 2013 [CHART]
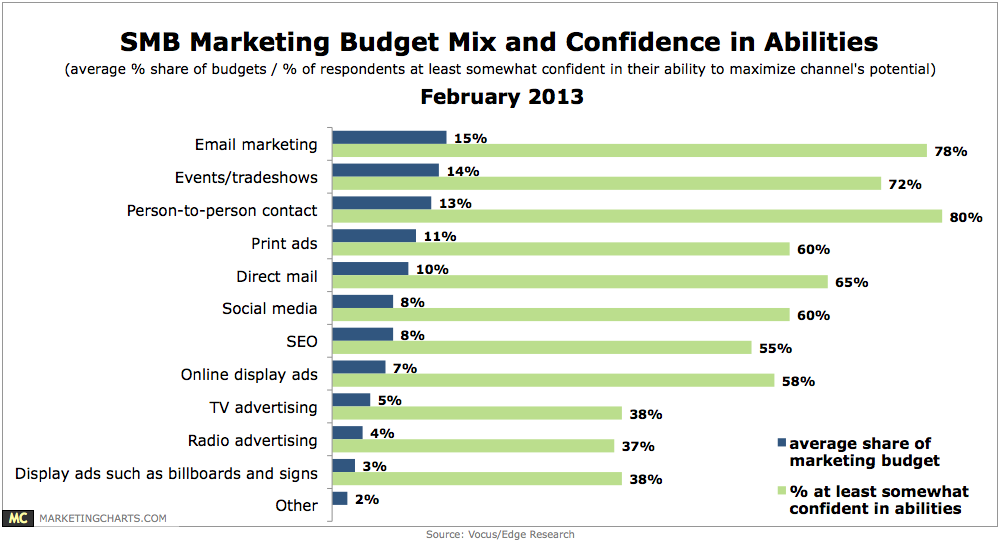
Email marketing captures an average 15% of SMB marketing budgets.
Read MorePreferences For Subscription vs. Ad-Supported Streaming Content By Device, November 2012 [CHART]

Most consumers still prefer free, ad-supported content though those with connected TVs are more likely to like the ad-free subscription model.
Read More10% Of Netflix Subscribers Have Streamed House Of Cards

About 10 percent had watched House of Cards during the first few weeks it was available.
Read MoreMarketing Strategies Gaining Favor In 2013 [CHART]
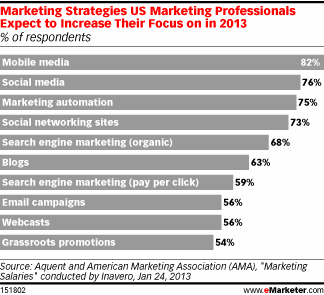
More than eight in 10 of those polled named mobile media as a target for increased focus, while just over three-quarters of respondents said the same for social media.
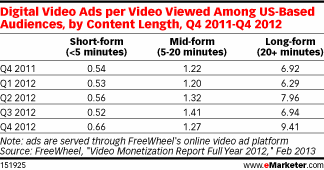
Read MoreVideo Ad Completion Rates, Q4 2011 – Q4 2012 [TABLE]
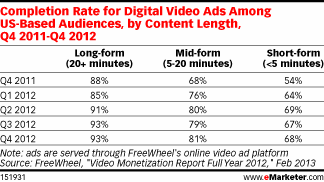
Ad completion rates were highest for long videos in Q4 2012 at 93%, compared with 81% for mid-form videos and 68% for short-form videos.
Read MoreVideo Ad View Rates, Q4 2011 – Q4 2012 [TABLE]
Total video views among internet users in the US were up 23% year over year in Q4 2012.
Read MoreConnected TV & Mobile Penetration, 2011-2016 [CHART]
Smart phone penetration in the world’s top 19 digital markets is expected to double from 35.5% last year to an average of 71.7% in 2015.
Read MoreOnline Videos Views By Device, Q4 2011 – Q4 2012 [CHART]
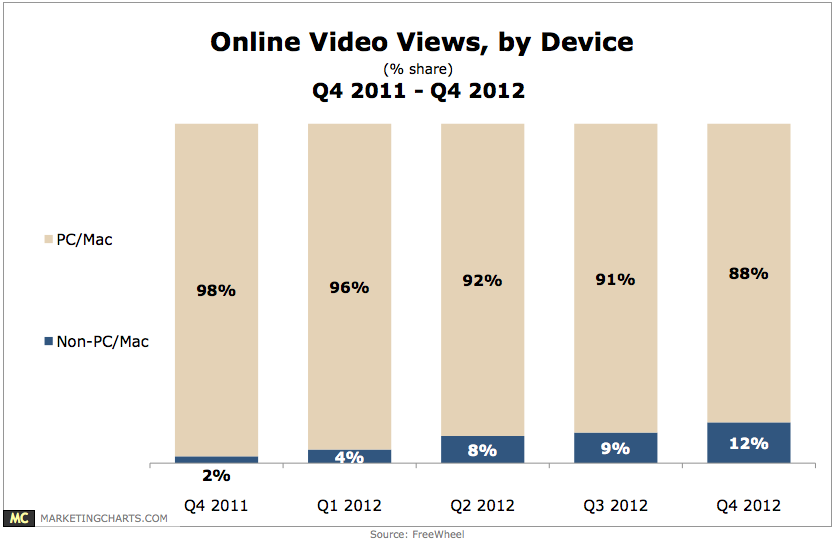
In Q4 2012, non-PC/Mac devices accounted for 12% of video views, triple their share from Q1, and 6 times their share from a year earlier.
Read MoreAmerican Small Business Content Marketing Plans, 2013 [CHART]
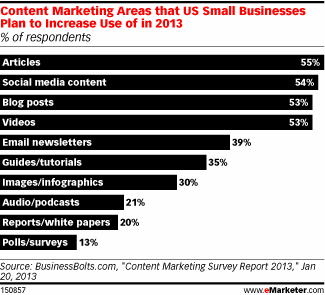
More than half of respondents cited articles, social media content, blog posts and video as likely to play a larger role in 2013.
Read More