Video Marketing
Frequency Of Online Video Viewing Away From YouTube, March 2013 [CHART]
Thirty-seven percent said they rarely watched on a site other than YouTube—11% said they never did.
Read MoreFrequency Of YouTube Visits, March 2013 [CHART]
The vast majority of US internet users (about 60%) visited YouTube at least once a week in March 2013.
Read MoreTV Viewership By Daypart, April 2013 [TABLE]
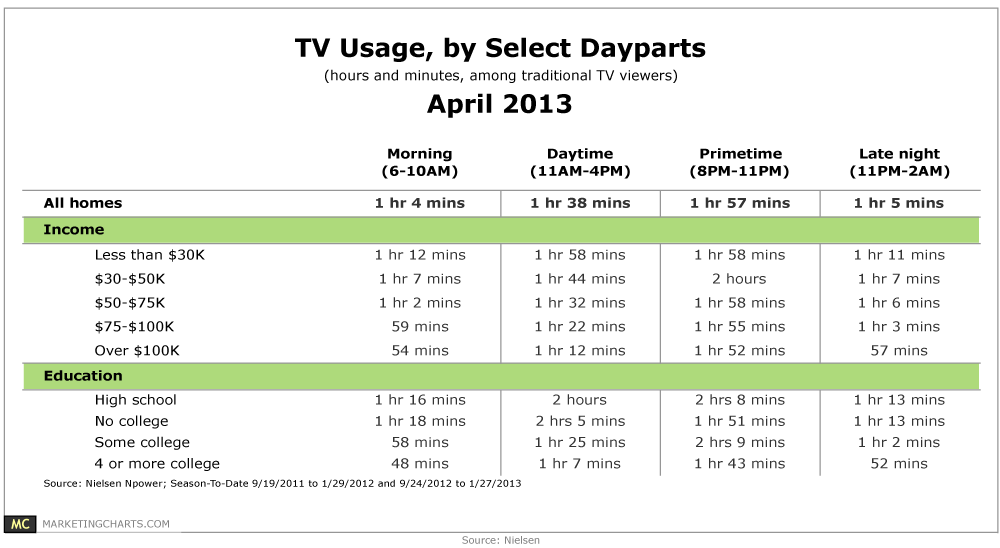
Nielsen’s figures reveal that traditional TV viewers watch close to 2 hours of TV per day during primetime hours, but they spend more than 1-and-a-half hours watching during the daytime hours of 11 AM-3 PM, too.
Read MoreOnline Viewership For Broadcast TV, March 2013 [TABLE]
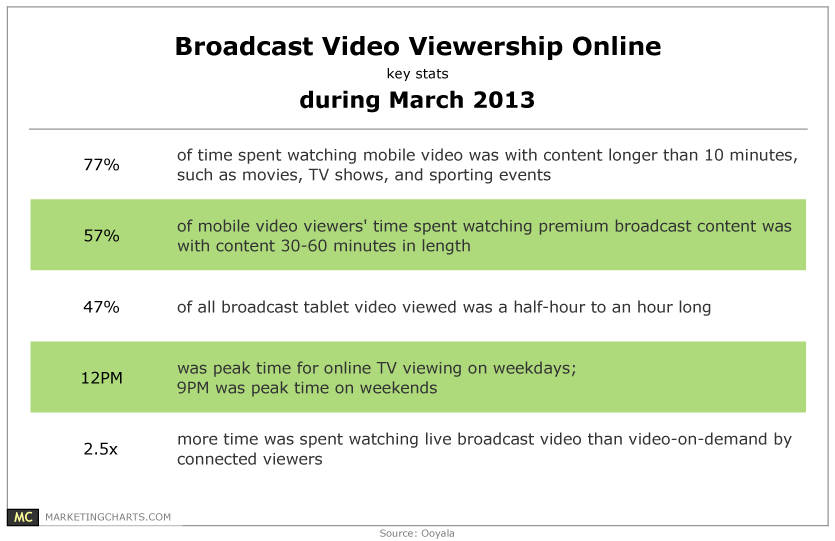
Connected viewers watched live broadcast video 2.5 times longer than video on demand (VOD), while 77% of time spent watching mobile video was with content longer than 10 minutes, such as movies, sporting events, and TV shows.
Read MoreTop 10 TV Ads of Q1 2013 [TABLE]

Only 2 Super Bowl spots cracked the top 10, with Budweiser’s “Brotherhood” coming in at number 5.
Read More
B2B Marketing Budgets [INFOGRAPHIC]
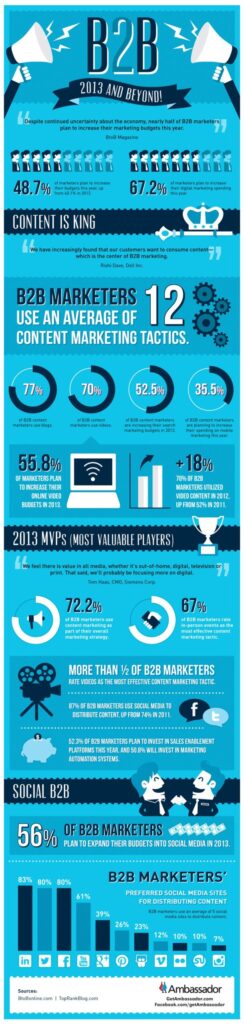
This infographic by Ambassador illustrates how B2B marketers are spending in 2013.
Read MoreIn-Stream Video Ad Response Rates By Gender, 2012 [TABLE]
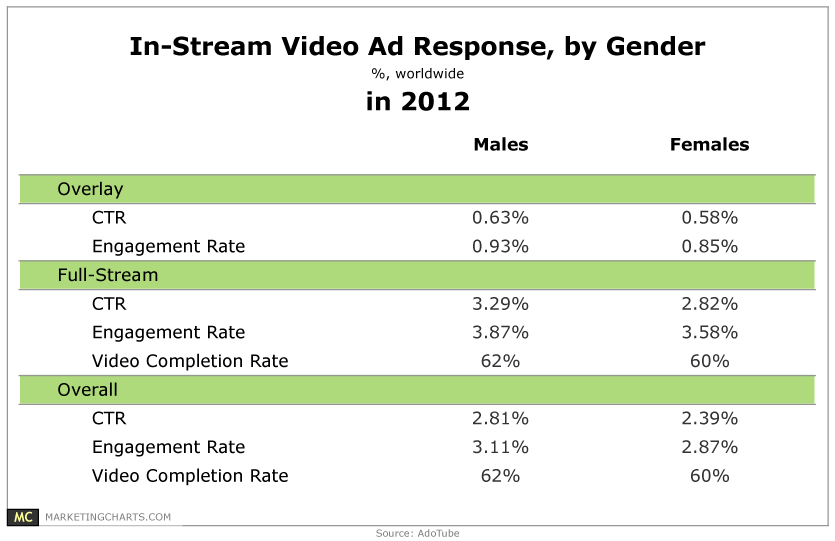
Men responded more to in-stream video ads than women, with a 17.6% higher click-through rate (CTR; 2.81% vs. 2.39%).
Read MoreUS TV vs Digital Video Ad Spending, 2011-2017 [CHART]
Spending on video ads served to PCs and mobile devices is expected to reach $4.14 billion this year, more than twice 2011 levels.
Read MoreVideo Advertising Impressions By Format, 2010-2012 [CHART]
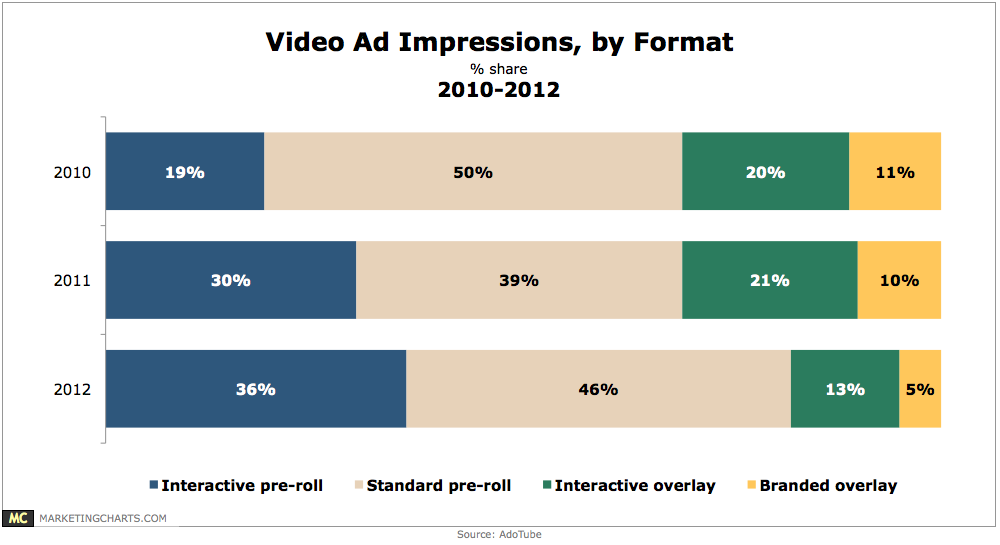
Interactive pre-rolls represented 36% of video ad impressions in 2012.
Read More