Video Marketing
Budget Increases For Online Video, 2012 vs 2013 [CHART]
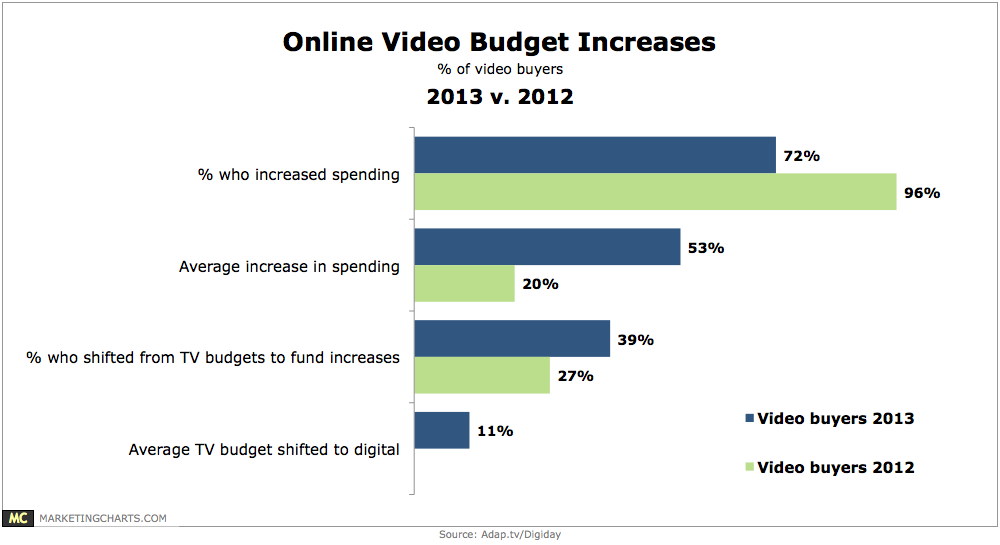
A recent study by Nielsen and the IAB recommended moving 15% of TV budgets to online video in order to increase reach at a lower cost.
Read MoreBroadcast TV Content Completion Rates Online By Device, 2012 [CHART]
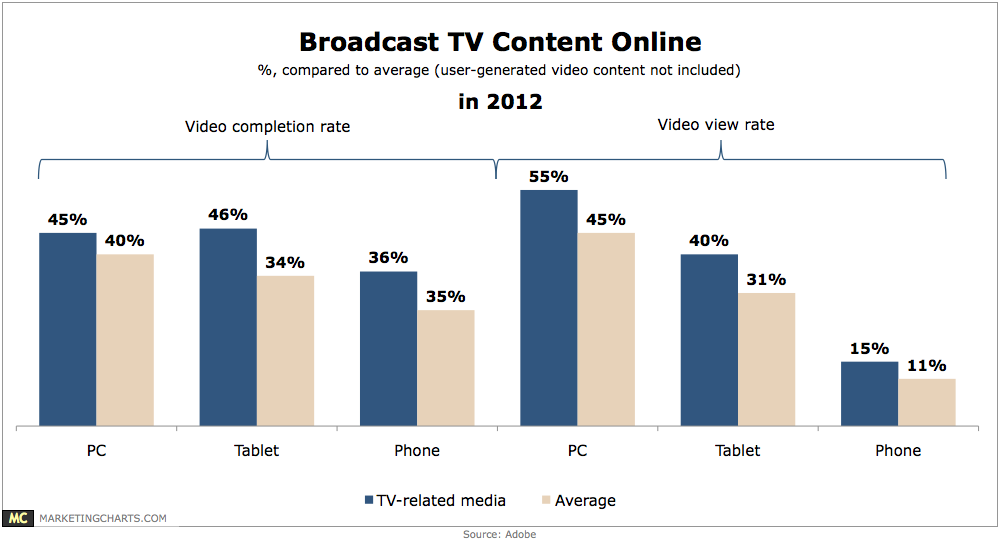
Compared to the average, completion rates for TV-related content (such as full episodes of TV shows) are 12.5% higher on PCs (45% vs. 40%), 31.4% higher on tablets (46% vs. 35%), and 33.3% higher on mobile phones (36% vs. 27%).
Read MoreMost Influential Ad Platforms For Automotive Purchase Decisions, March 2012 [CHART]
55% of respondents’ digital ad spending went to paid search engine marketing (SEM).
Read MoreOnline Video Ad Spending, 2011-2014 [CHART]
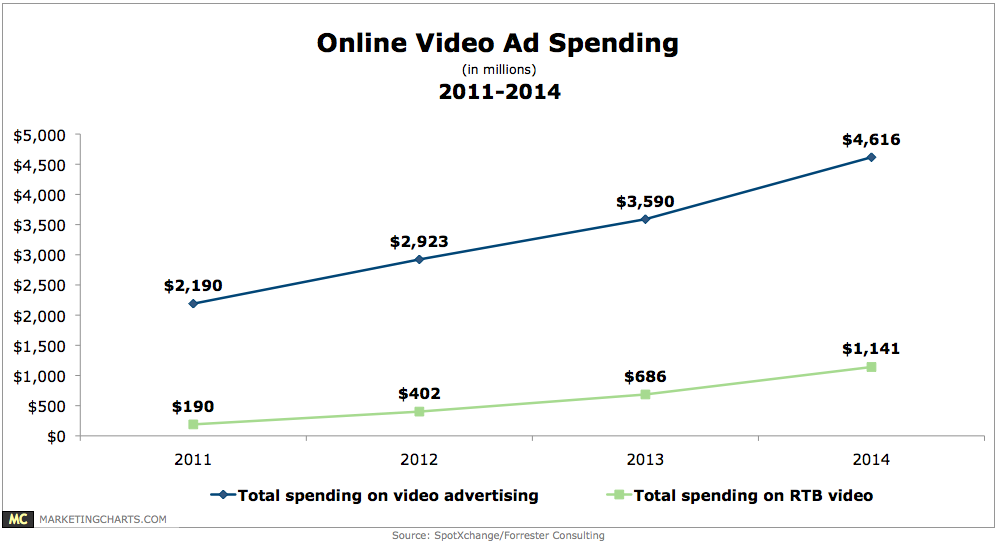
Total spending for real-time bidding (RTB) on video ads is estimated to grow by a compound annual rate of 57% between 2011 and 2014.
Read MoreSites Most Likely To Influence A Purchase, December 2012 [CHART]
Facebook was the social network most likely to influence purchases among US internet users surveyed by Technorati in December 2012.
Read MoreAmerican Cord Cutters, 2008-2013 [CHART]
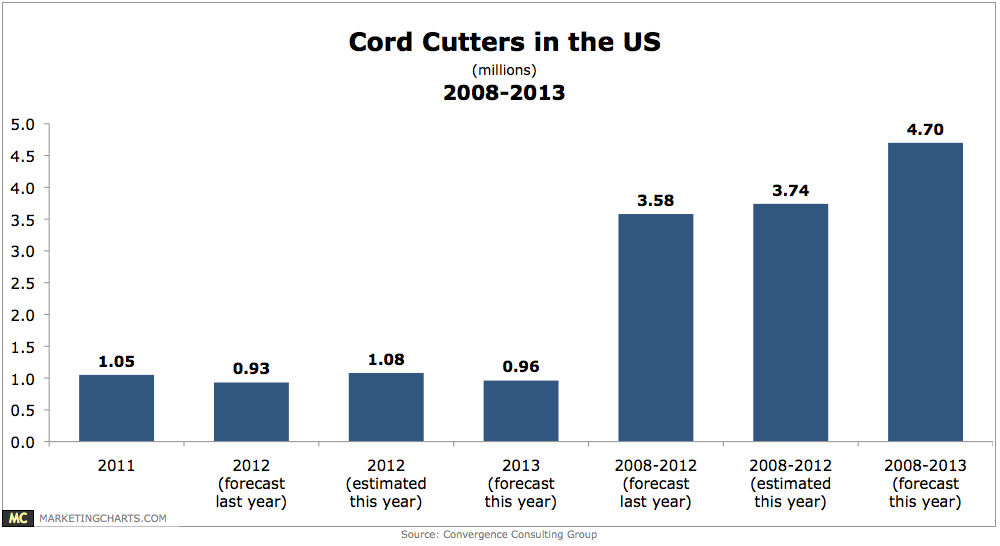
The number of American pay TV subscribers cutting the cord to focus solely on Netflix, over the air, online, and other sources is growing faster than expected.
Read MoreTop Tablet Ad Models' Performance, April 2013 [CHART]
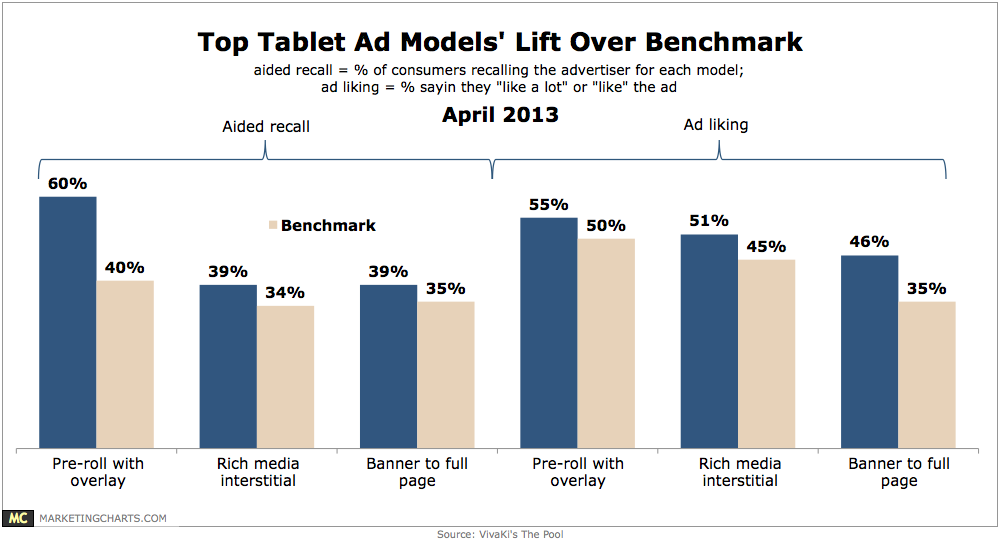
An exhaustive global study concludes that the top three tablet advertising models are pre-roll with overlay; rich media interstitial; and banner to full page rich media.
Read MoreOnline Radio vs. Online Video Consumption, April 2013 [CHART]
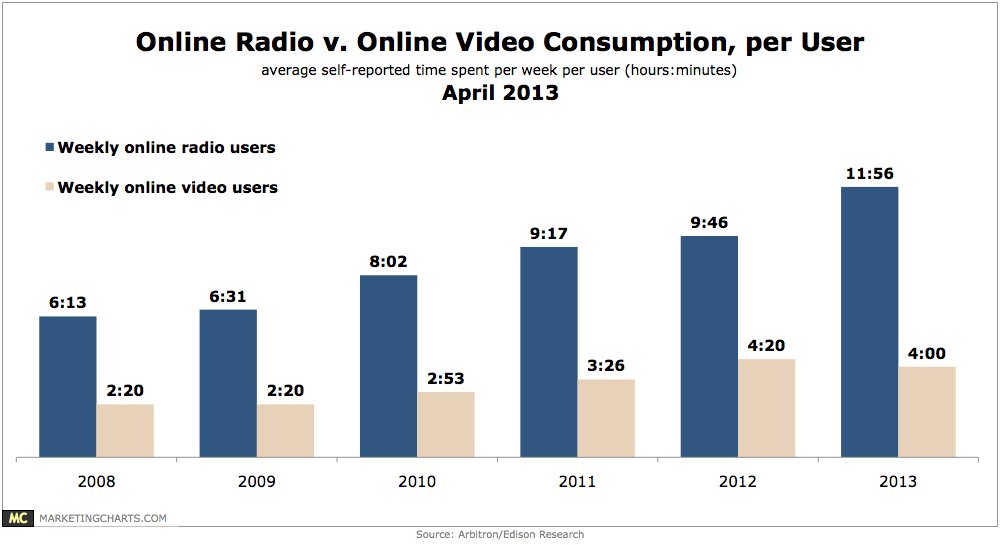
Online radio is far ahead of online video in terms of weekly consumption.
Read More
Top 10 Online Video Properties By Unique Viewers, December 2012 [TABLE]
Google sites made up the vast majority of online video viewership in the US in terms of unique viewers, videos viewed and time spent per viewer.
Read More