Video Marketing
Effectiveness Of Video Ads By Tactic, March 2013 [CHART]
The vast majority of agency executives (75%) said online video ads were equally or more effective than traditional TV.
Read MoreUK Marketers & Digital Media Spending, May 2013 [TABLE]
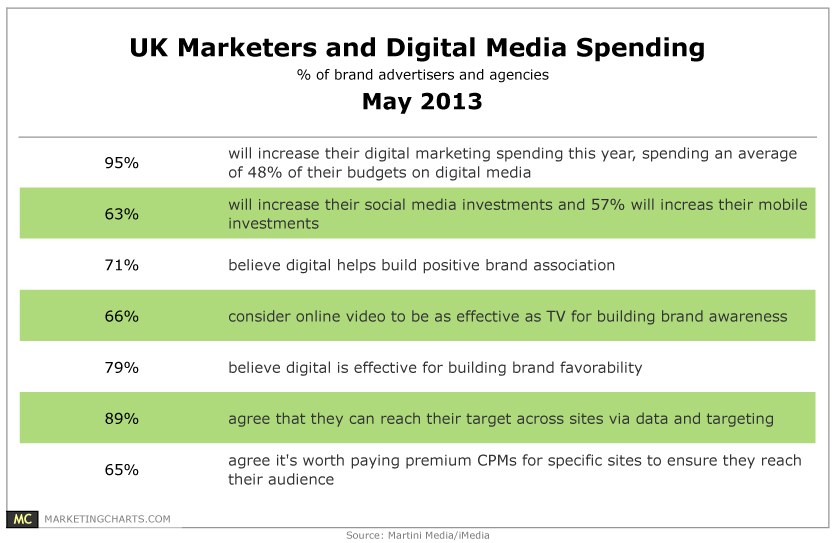
95% of brand advertisers and agencies responding to the survey said they will increase their digital marketing spending this year, with fully 48% of total budgets going to digital media.
Read MoreGoogle Glass & Attention Data

With Google Glass, Google may be creating a whole new set of data that has never existed before: Attention Data.
Read MoreTop North American Downstream Traffic Sources, May 2013 [CHART]
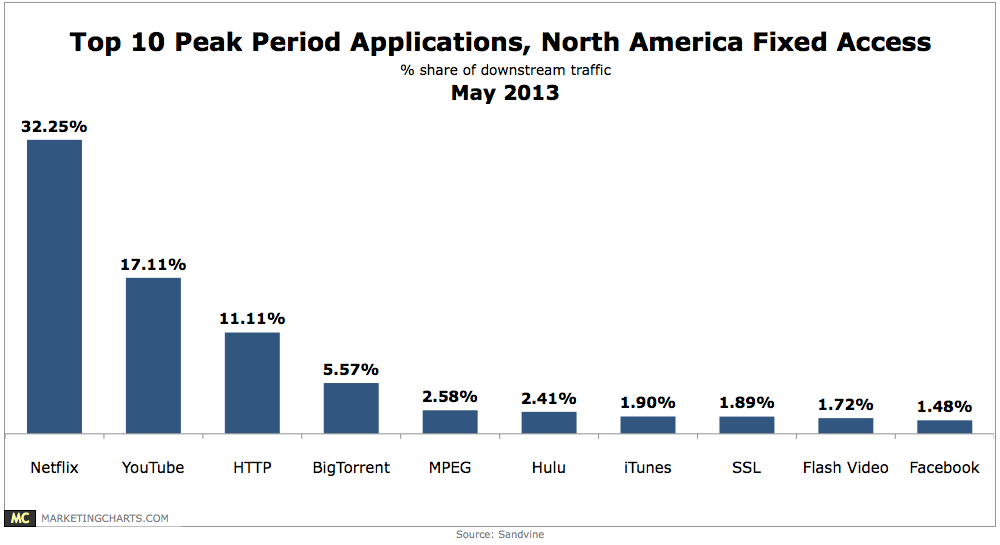
Netflix accounts for 32.3% share of North American peak downstream fixed access traffic, a slight dip from H1 2012, with YouTube next at 17.1%.
Read MoreAmericans & On Demand Entertainment, May 2013 [TABLE]
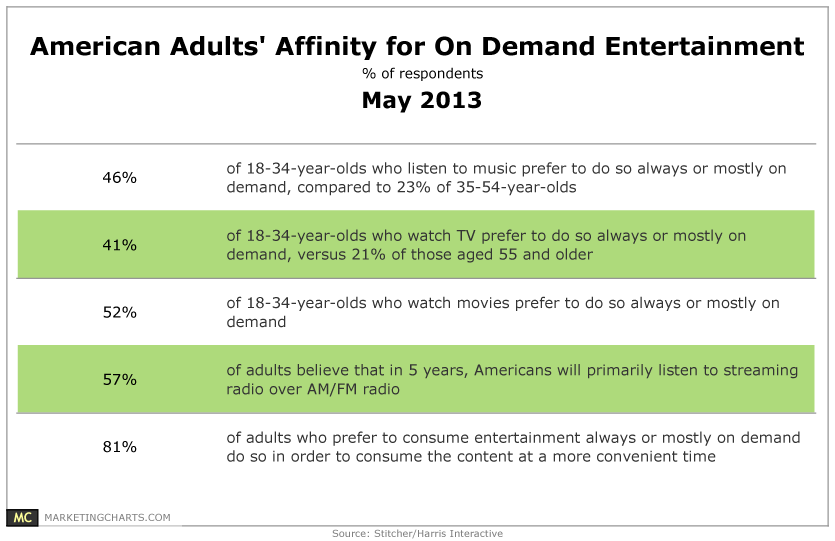
Americans aged 18-34 are more likely than their older counterparts to prefer a range of entertainment types on-demand.
Read MoreAd Click-Through Rate By Format, 2012 [CHART]
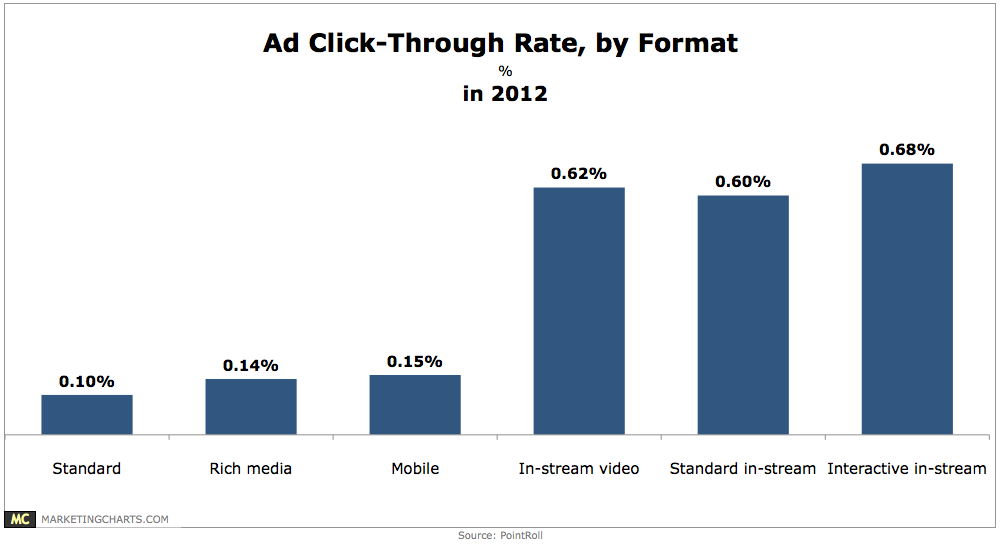
In-stream video ads achieved an average click-through rate (CTR) of 0.62% last year, far outpacing mobile (0.15%), rich media (0.14%) and standard banner (0.1%) ads.
Read MoreBeyond Social Media: Nutella & Skittles Go Nuts [PODCAST]

This week: Nutella & Skittles go nuts, Hanes gets all destructive, Verizon demonstrates its services by partnering with a bear.
Read MoreConsumers Who Find Native Advertising Misleading, October 2012 [CHART]
In October 2012, a high percentage of US internet users found ads that appeared as content misleading.
Read MoreEffectiveness Of Native Video Ads, December 2012 [CHART]
A survey of US media agency executives in late 2012 and found that nearly 50% considered native video ads to be more effective than conventional ads at hitting key performance indicators
Read MorePercent Of Viewing Time Spent Using Tablets By Generation, May 2013 [CHART]
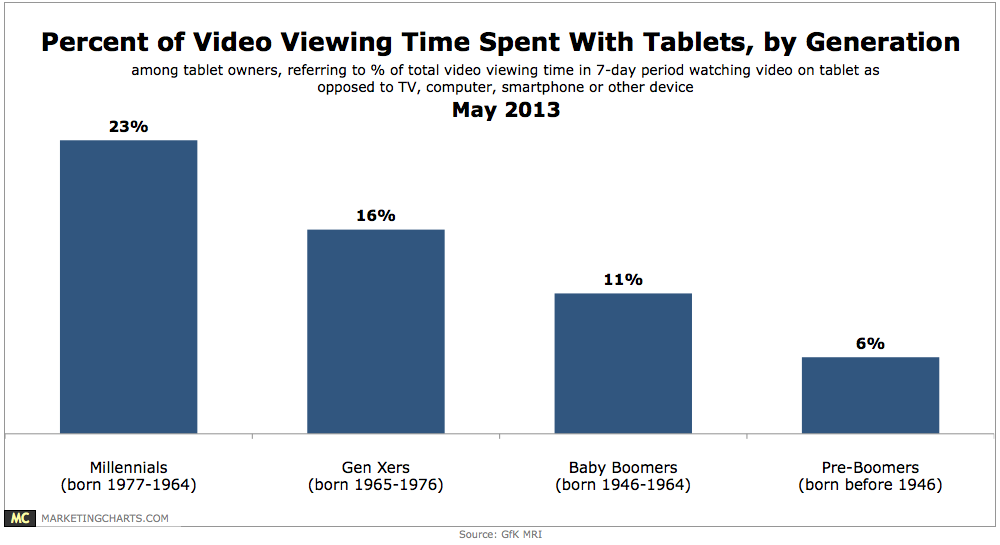
Among tablet owners, Millennials (born 1977-1994) spend on average 23% of their total video viewing time (time spent watching video on any device, including TV, in a 7-day period) with their devices.
Read More