Video Marketing
Vine Growth, December 2012 – May 2013 [CHART]
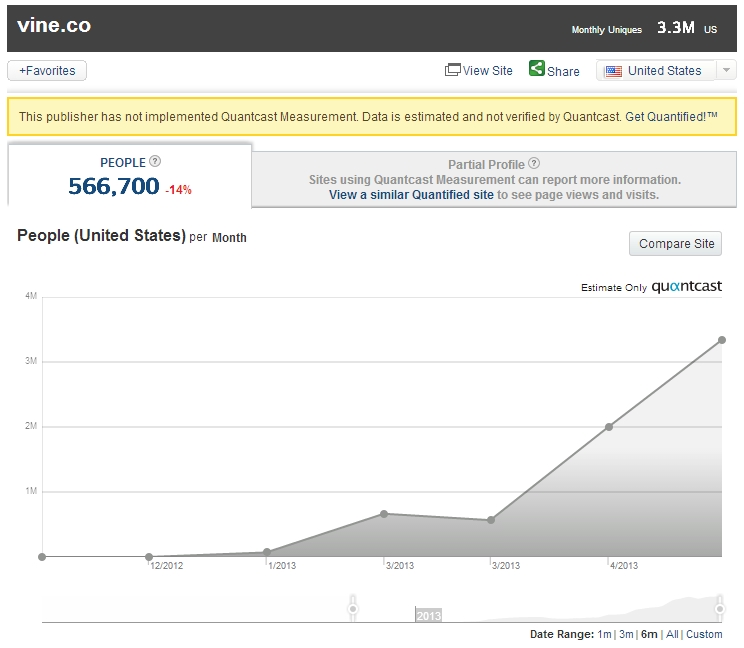
From just 77,000 unique visitors in January, Vine’s website vine.co grew to 3.6 million unique desktop visitors in May.
Read More
American Sports Content Consumption [INFOGRAPHIC]
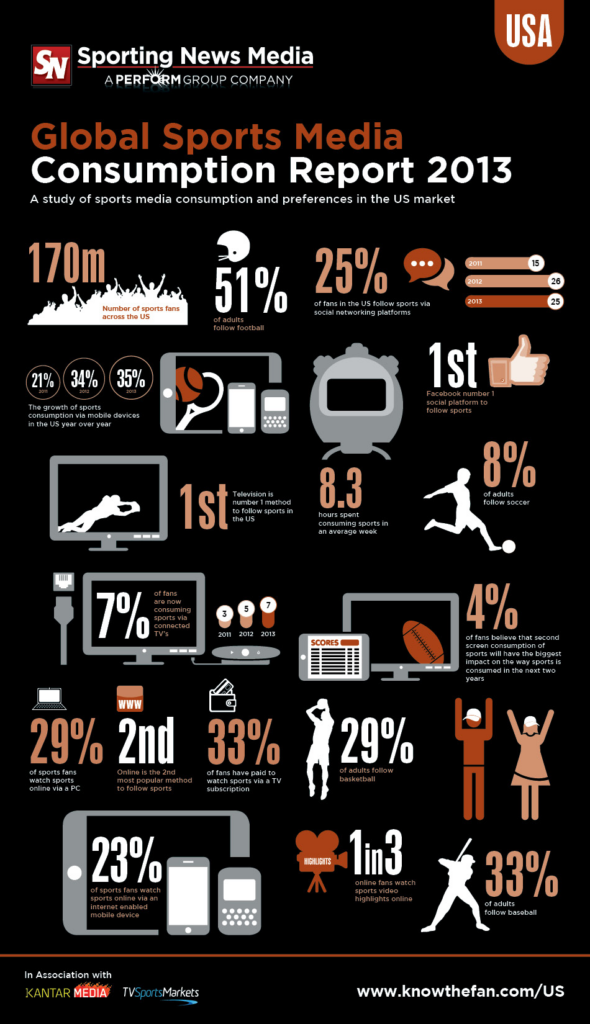
25% of sports fans use social media to follow leagues, teams and players online.
Read MoremCommerce Activities Of Affluent Americans By Device, April 2013 [TABLE]
Among US internet users ages 21 and older earning more than $150,000, more than eight in 10 owned a smart phone, while 56% reported owning a tablet.
Read MoreWhere Americans Watch TV By Device, January 2013 [TABLE]
While smart mobile device users can now watch TV from anywhere, they still favor sitting at home to watch their shows.
Read MoreTime Americans Spend Watching Mobile TV By Device, January 2013 [CHART]
Only 2% of total TV viewership by American broadband subscribers who watched at least five hours of TV per week occurred on a tablet or smart phone.
Read MoreSubscription On-Demand Video Market Share, Q1 2012 vs Q1 2013 [CHART]
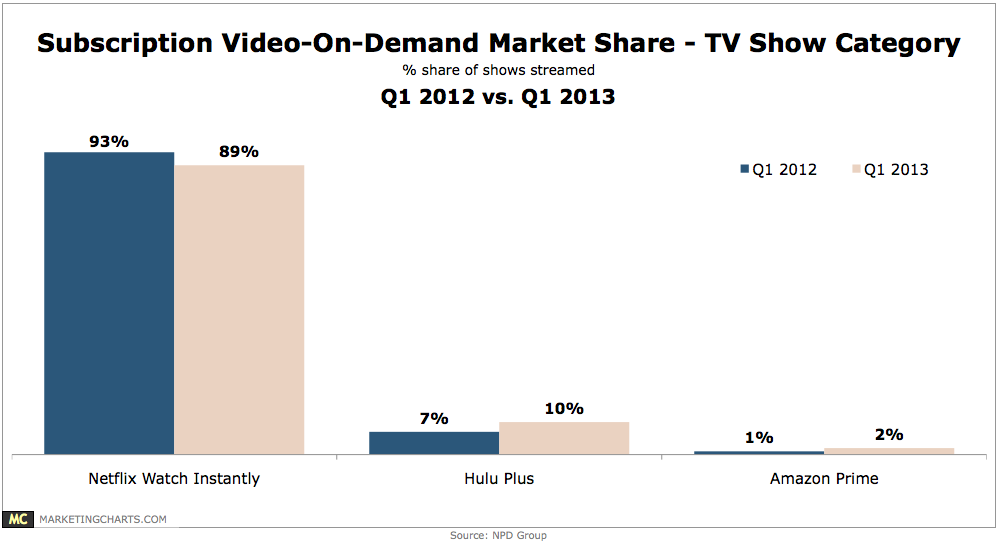
Netflix accounts for almost one-third of North American peak downstream internet traffic.
Read MoreTelevision Viewing Places By Device, June 2013 [TABLE]
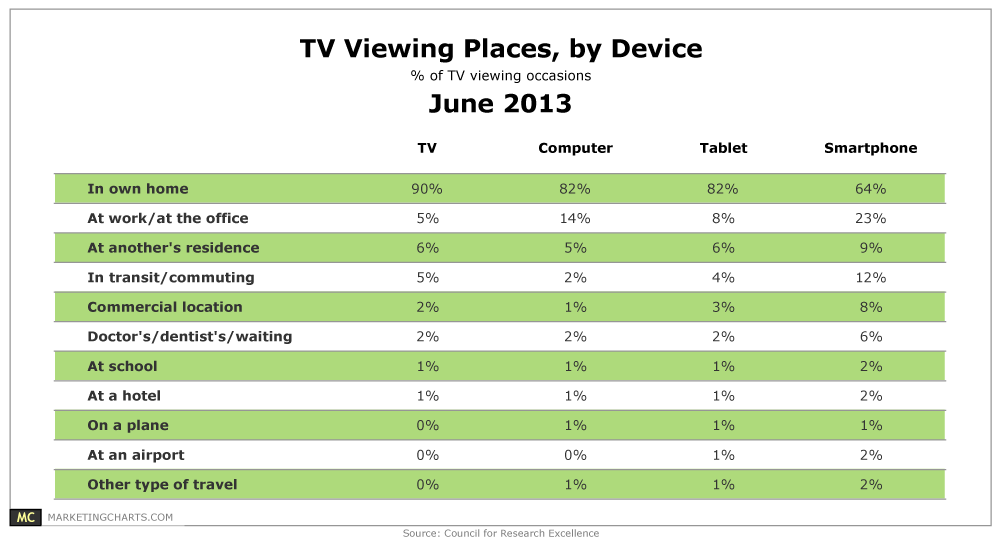
64% of smart phone TV viewing occasions occurred at home.
Read MorePreferred Television Genres By Viewing Device, June 2013 [CHART]
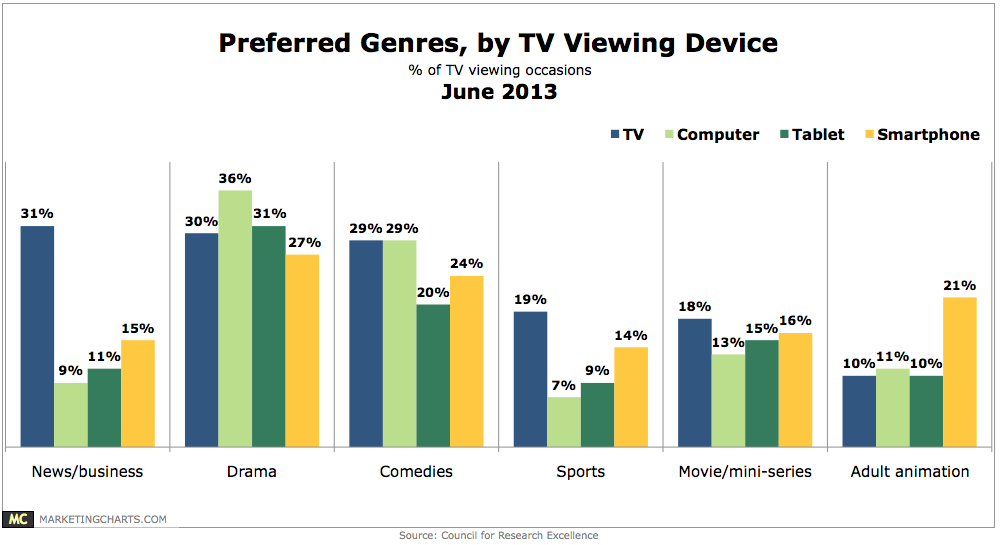
On the traditional TV, news and business (31%) got the edge on drama (30%) and comedies (29%) as the top genres by percentage of viewing occasions.
Read MoreTV Viewing Times By Device, June 2013 [TABLE]
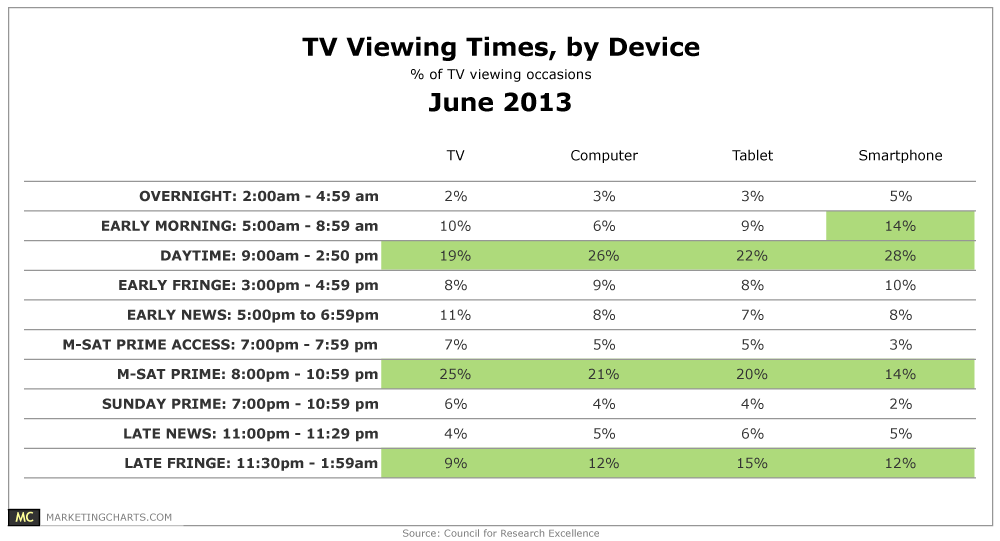
A plurality of tablet (22%) and smart phone (28%) TV viewing occasions tracked occurred during the daytime, between 9 AM and 3 PM.
Read More